Live Inventory Overview
Overview
The Live Inventory page provides an aggregated view of all of your Integration Assets in an Asset Class. This page has several search features that allow you to filter and view information about specific assets. Access this page by selecting the Live Inventory icon on the Navigation bar and clicking the Devices or Users link from the dropdown.
Inventory Views
The Live Inventory page has three ways for you to view your assets: List, Geolocation (map), and Network.
List
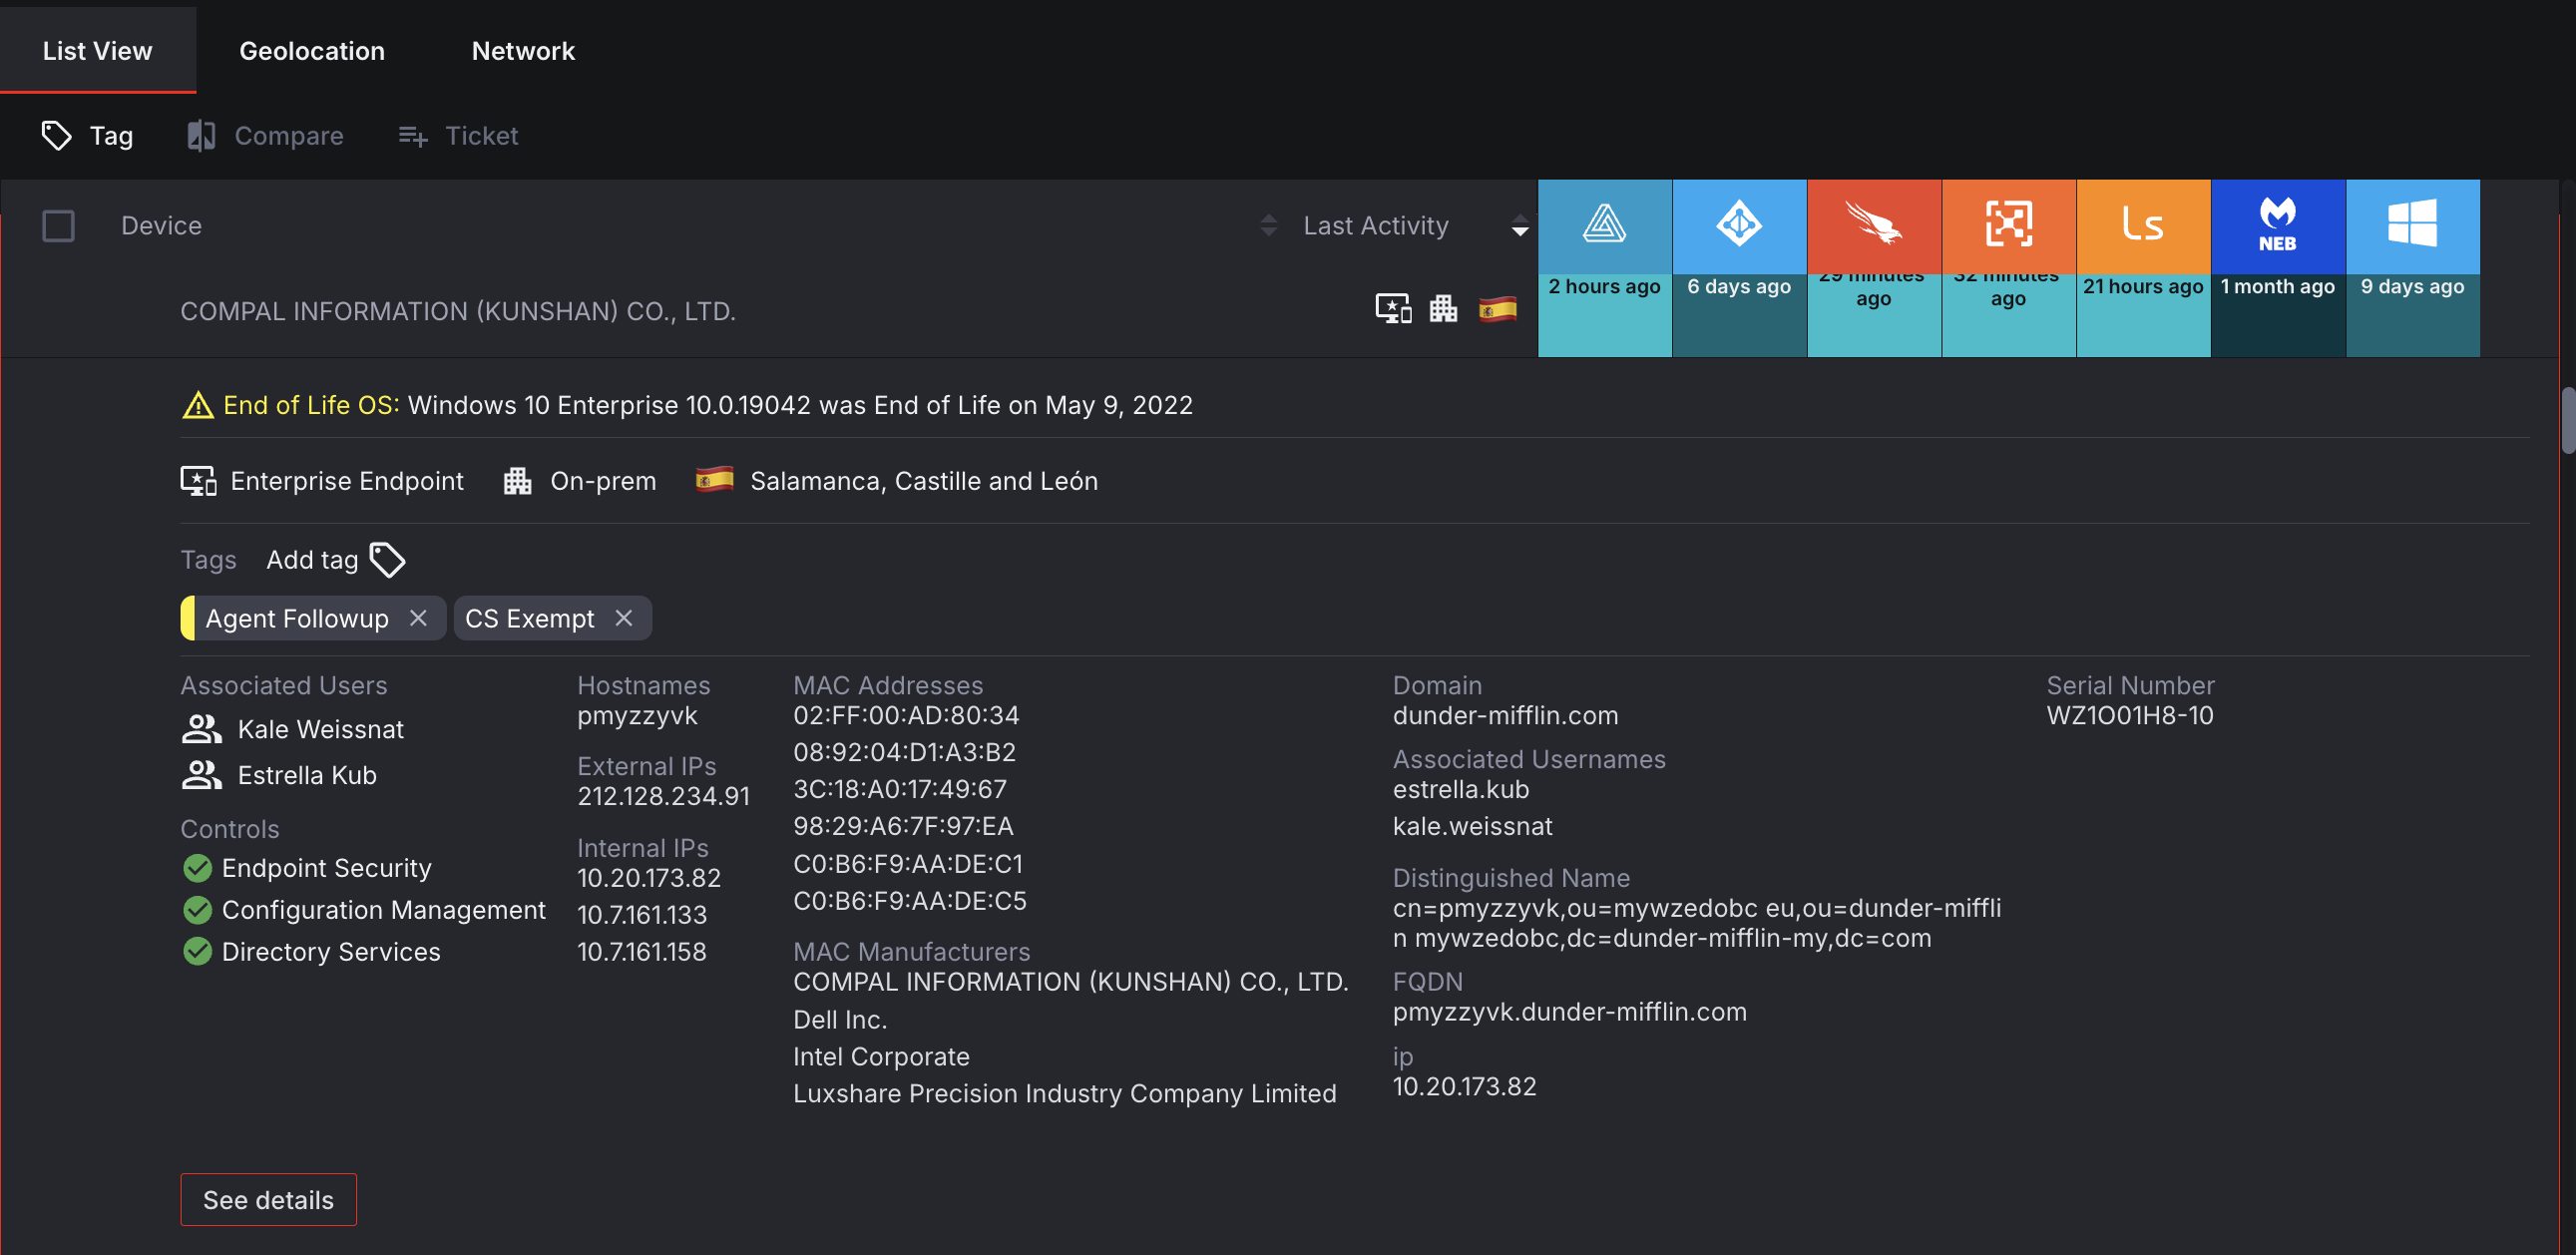
Of the three views, List view provides the most comprehensive snapshot of your assets. In this view, you will be able view asset details, Integrations, and more.
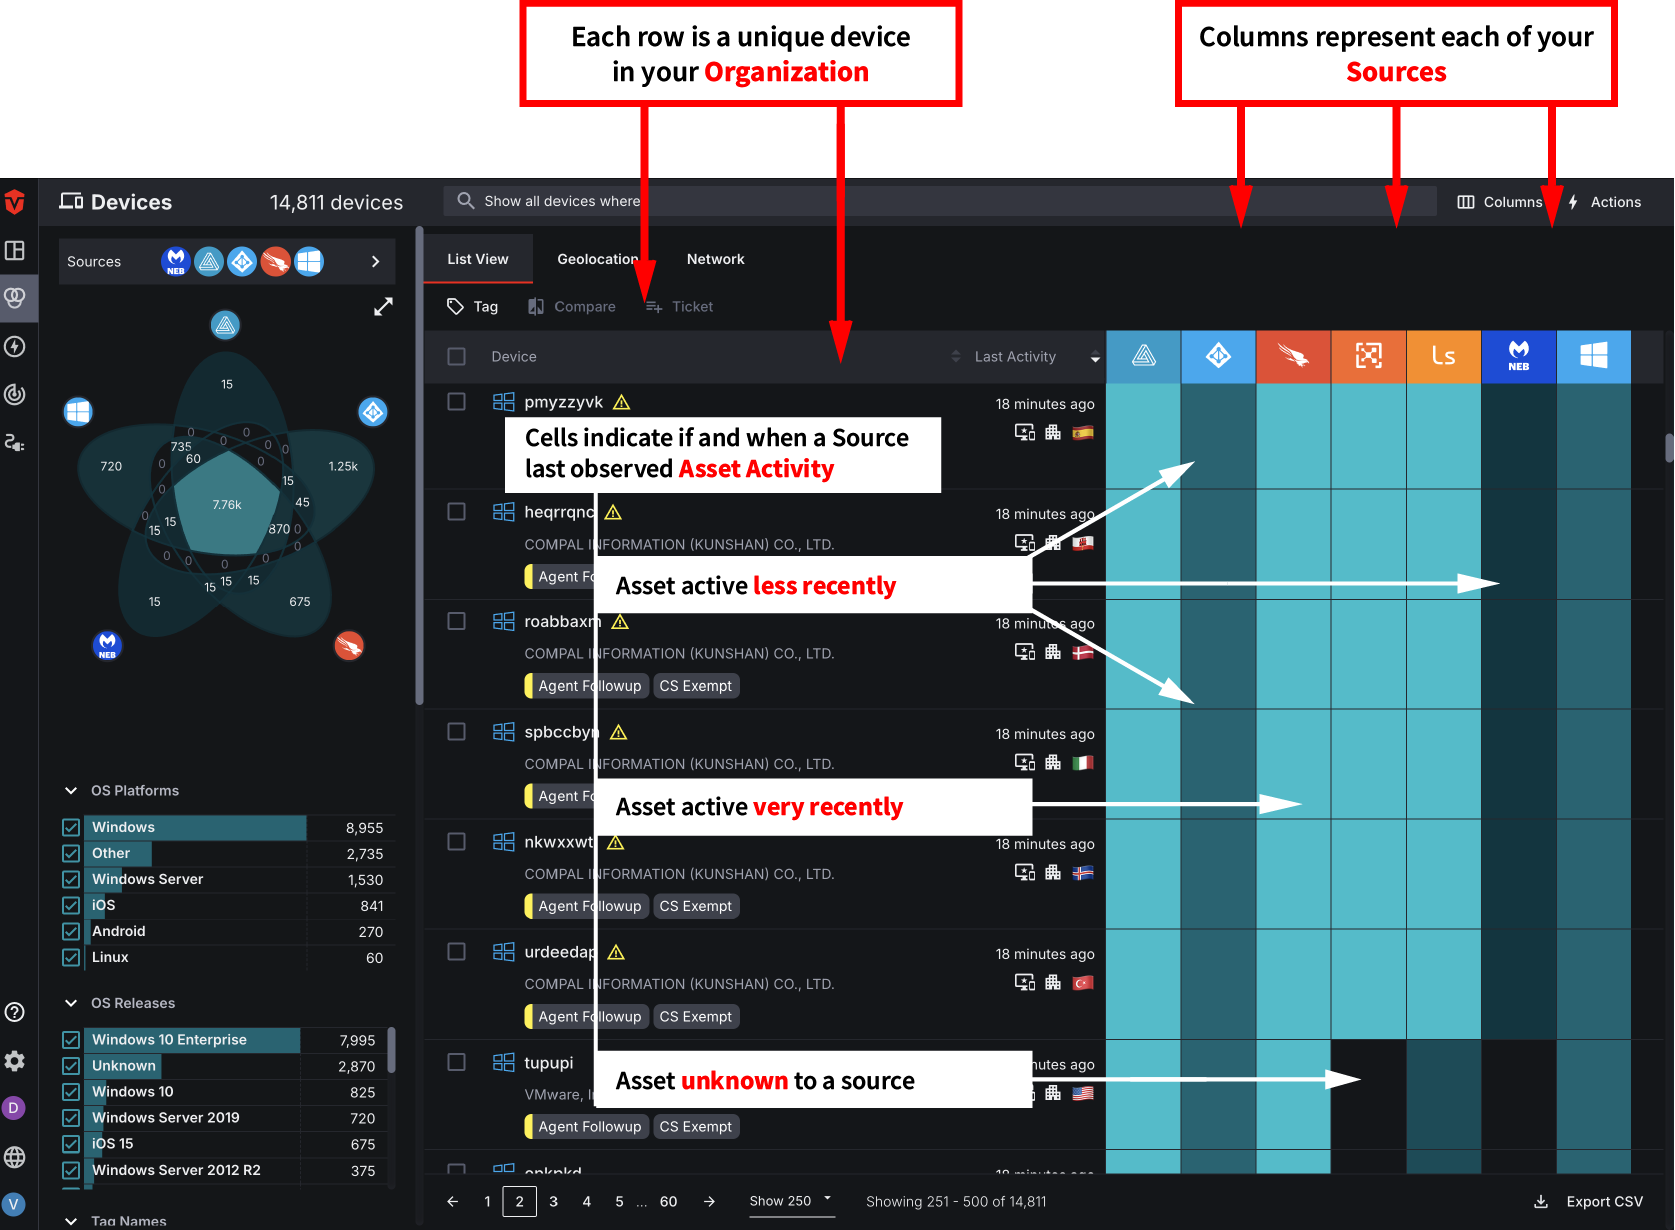
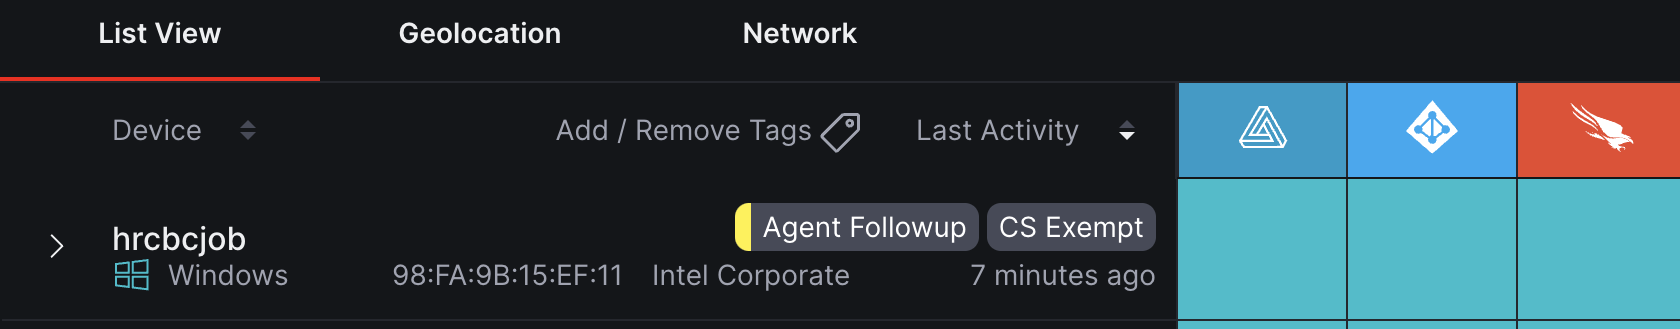
In this view, each Row represents a unique asset in your Organization. Select the caret (![]() ) to reveal additional information about it.
) to reveal additional information about it.
The heat map is used to visualize when an asset's Last Activity was identified by a specific Source Integration. Columns in the heat map correspond to each of your configured Integrations. The cells within it are used to indicate if and when a particular asset has been identified as being active by an Integration. Lighter cells represent assets that have been active more recently while darker cells represent ones that have been active less recently. If a cell is black, it means the asset has never been observed by the Integration.
Geo
Geo view allows you to view assets by their geographical location. Select a teal map point to zoom in on an area where multiple assets are located.
If only one asset is present in a location, you may click on it to view details about it. If two or more assets are present in a location, select the See details link to view their information in List view.
Network
Network view organizes your assets into three categories: On-Premise, Cloud, and Unknown. Assets in the latter category are then broken down further and organized by country.
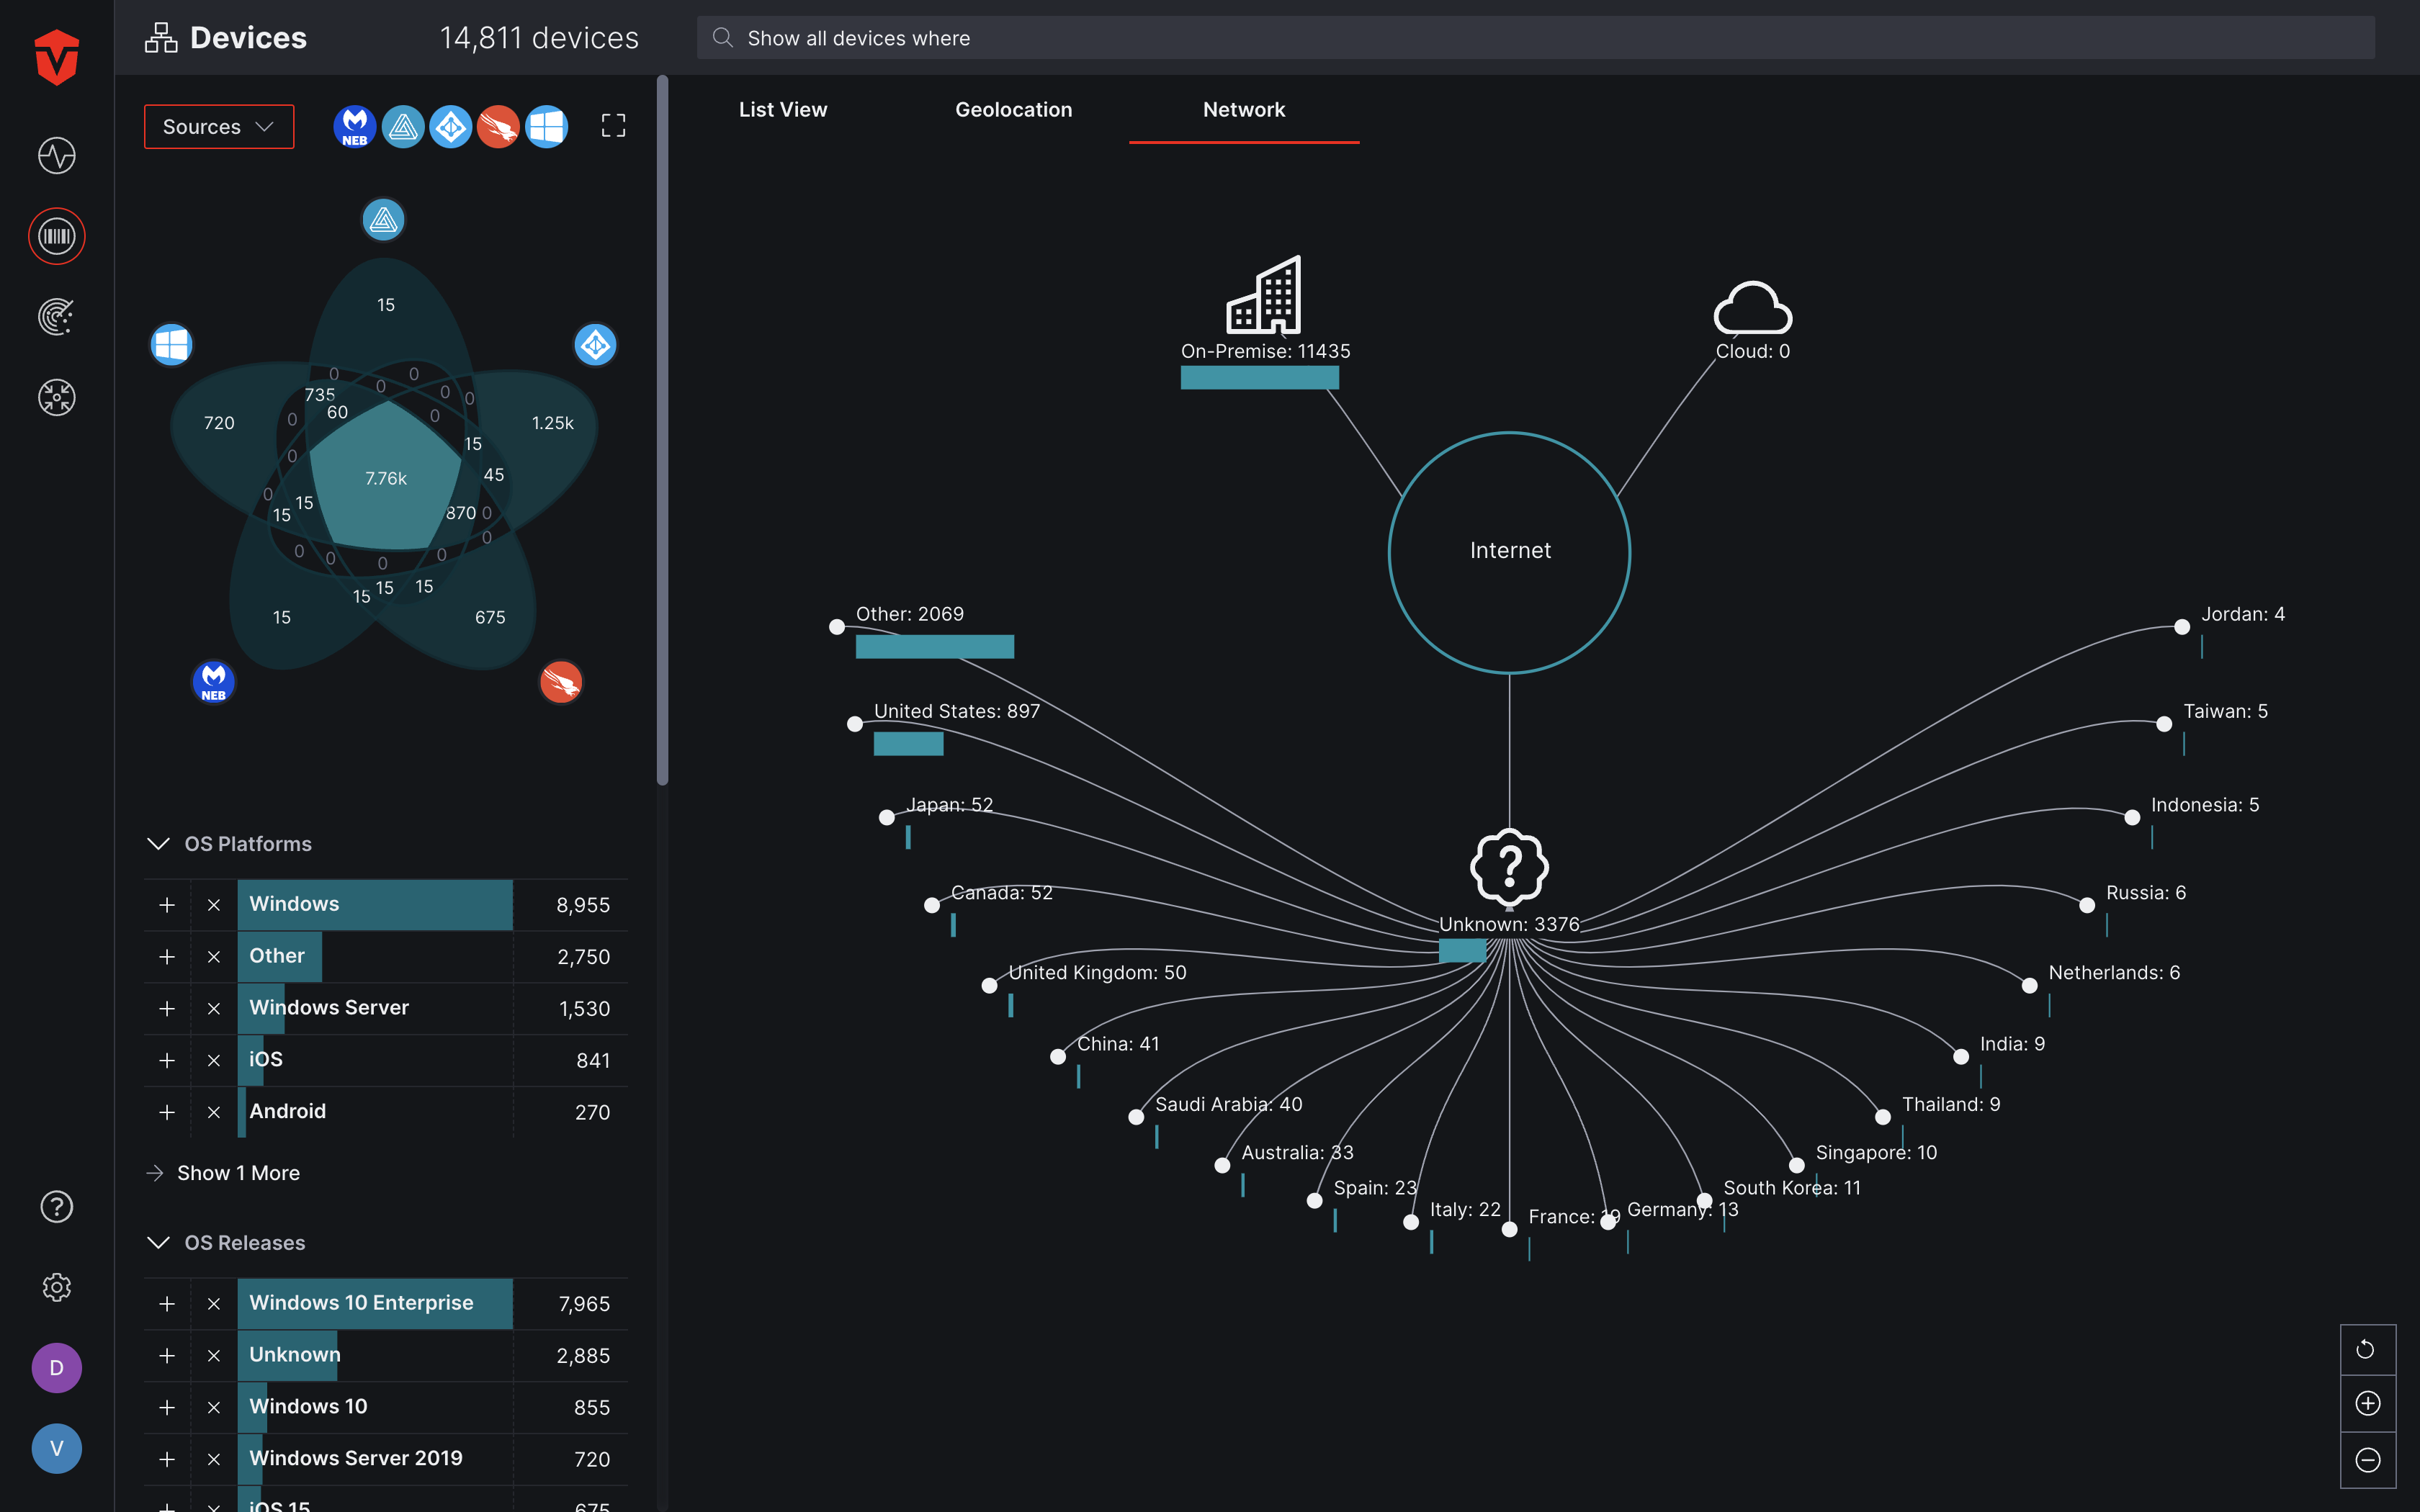
Integration Venn Diagram
The Integration Venn Diagram tool compares asset data from up to five Integrations then organizes it into a venn diagram to visually communicate what assets are recognized by each Integration. Integrations can be added and removed from the Integrations dropdown menu. You may also remove an Integration by selecting its icon to the right of the dropdown.
Upon inspection, you'll likely notice that not all of your assets are recognizable to each of the Integrations you've selected. Don't panic! It isn't uncommon for assets to be unaccounted for by one or more Integrations – in fact, it is one of the many problems the Aurora ASM platform was built to solve!
From here you can select various sections of the Venn Diagram to view a list of the assets in them and assess any coverage gaps.
Filters
In addition to the Venn Diagram tool, the Live Inventory page also has a number of filters you can use in your asset searches. These filters include:
Device
OS Platform– Filter by operating system platform (i.e. Windows)OS Release– Filter by a specific operating system release (i.e. Windows 10 Enterprise)Tag Names– Filter by a user-assigned tagMAC Manufactures– Filter for devices with network hardware manufactured by a specific MAC manufacturer (i.e. Intel Corporate)Region– Filter by world-region (i.e. North America)Country– Filter by countryDomain– Filter for devices associated with a specific domain name (i.e.www.company.com).- Note: In this context, domain names are most often assigned using a domain controller such as Microsoft Active Directory. This allows organizations to register and keep track of device assets.
User
Domains– Filter by the domain associated with a user (i.e. your-company.com )Tag Names– Filter by a tag that has been assigned to a user (i.e. Admin)
Vulnerability
Severity– Filter by the severity of a vulnerability (i.e. High)Categories– Filter by vulnerability category (i.e. Web Servers)
Tag Names– Filter by a tag that has been assigned to a vulnerability (i.e. Incident)
Select the checkboxes to include ( ) or exclude (
 ) assets in a specific filter category.
Select a filter category's name to isolate assets in it. Select the name again to display assets for all filter categories.
Query Builder
For more granular searches that may not be accomplishable using the Venn Diagram or filtering tools, you may wish to write a query.
The Query Builder is located at the top of the Live Inventory page and has a number of rules and parameters that can be used to create and execute complex queries to find gaps in asset coverage that may not be as obvious. Click here to learn more.

Actions Panel
The Actions panel is only accessible to Admin users.
The Actions panel is located on the Live Inventory page and can be accessed by selecting the Actions link in the top-right corner of the page.
It provides a collection of tools designed to simplify remediation workflows for your assets. This includes tagging assets, comparing attributes between assets, and sending outbound tickets with asset information to platforms such as Jira and SeviceNow.
Click here to learn more about the Actions Panel and Action Center.
Updated 2 months ago