Asset Details Overview
Overview
In addition to the information found on the Live Inventory page, you can also view additional information about specific assets on their Asset Details page.
Asset Details pages can be accessed by identifying the asset you would like to view in the Asset List on the Live Inventory page and selecting its name. Alternatively, you can also open its dropdown and select the See Details button.
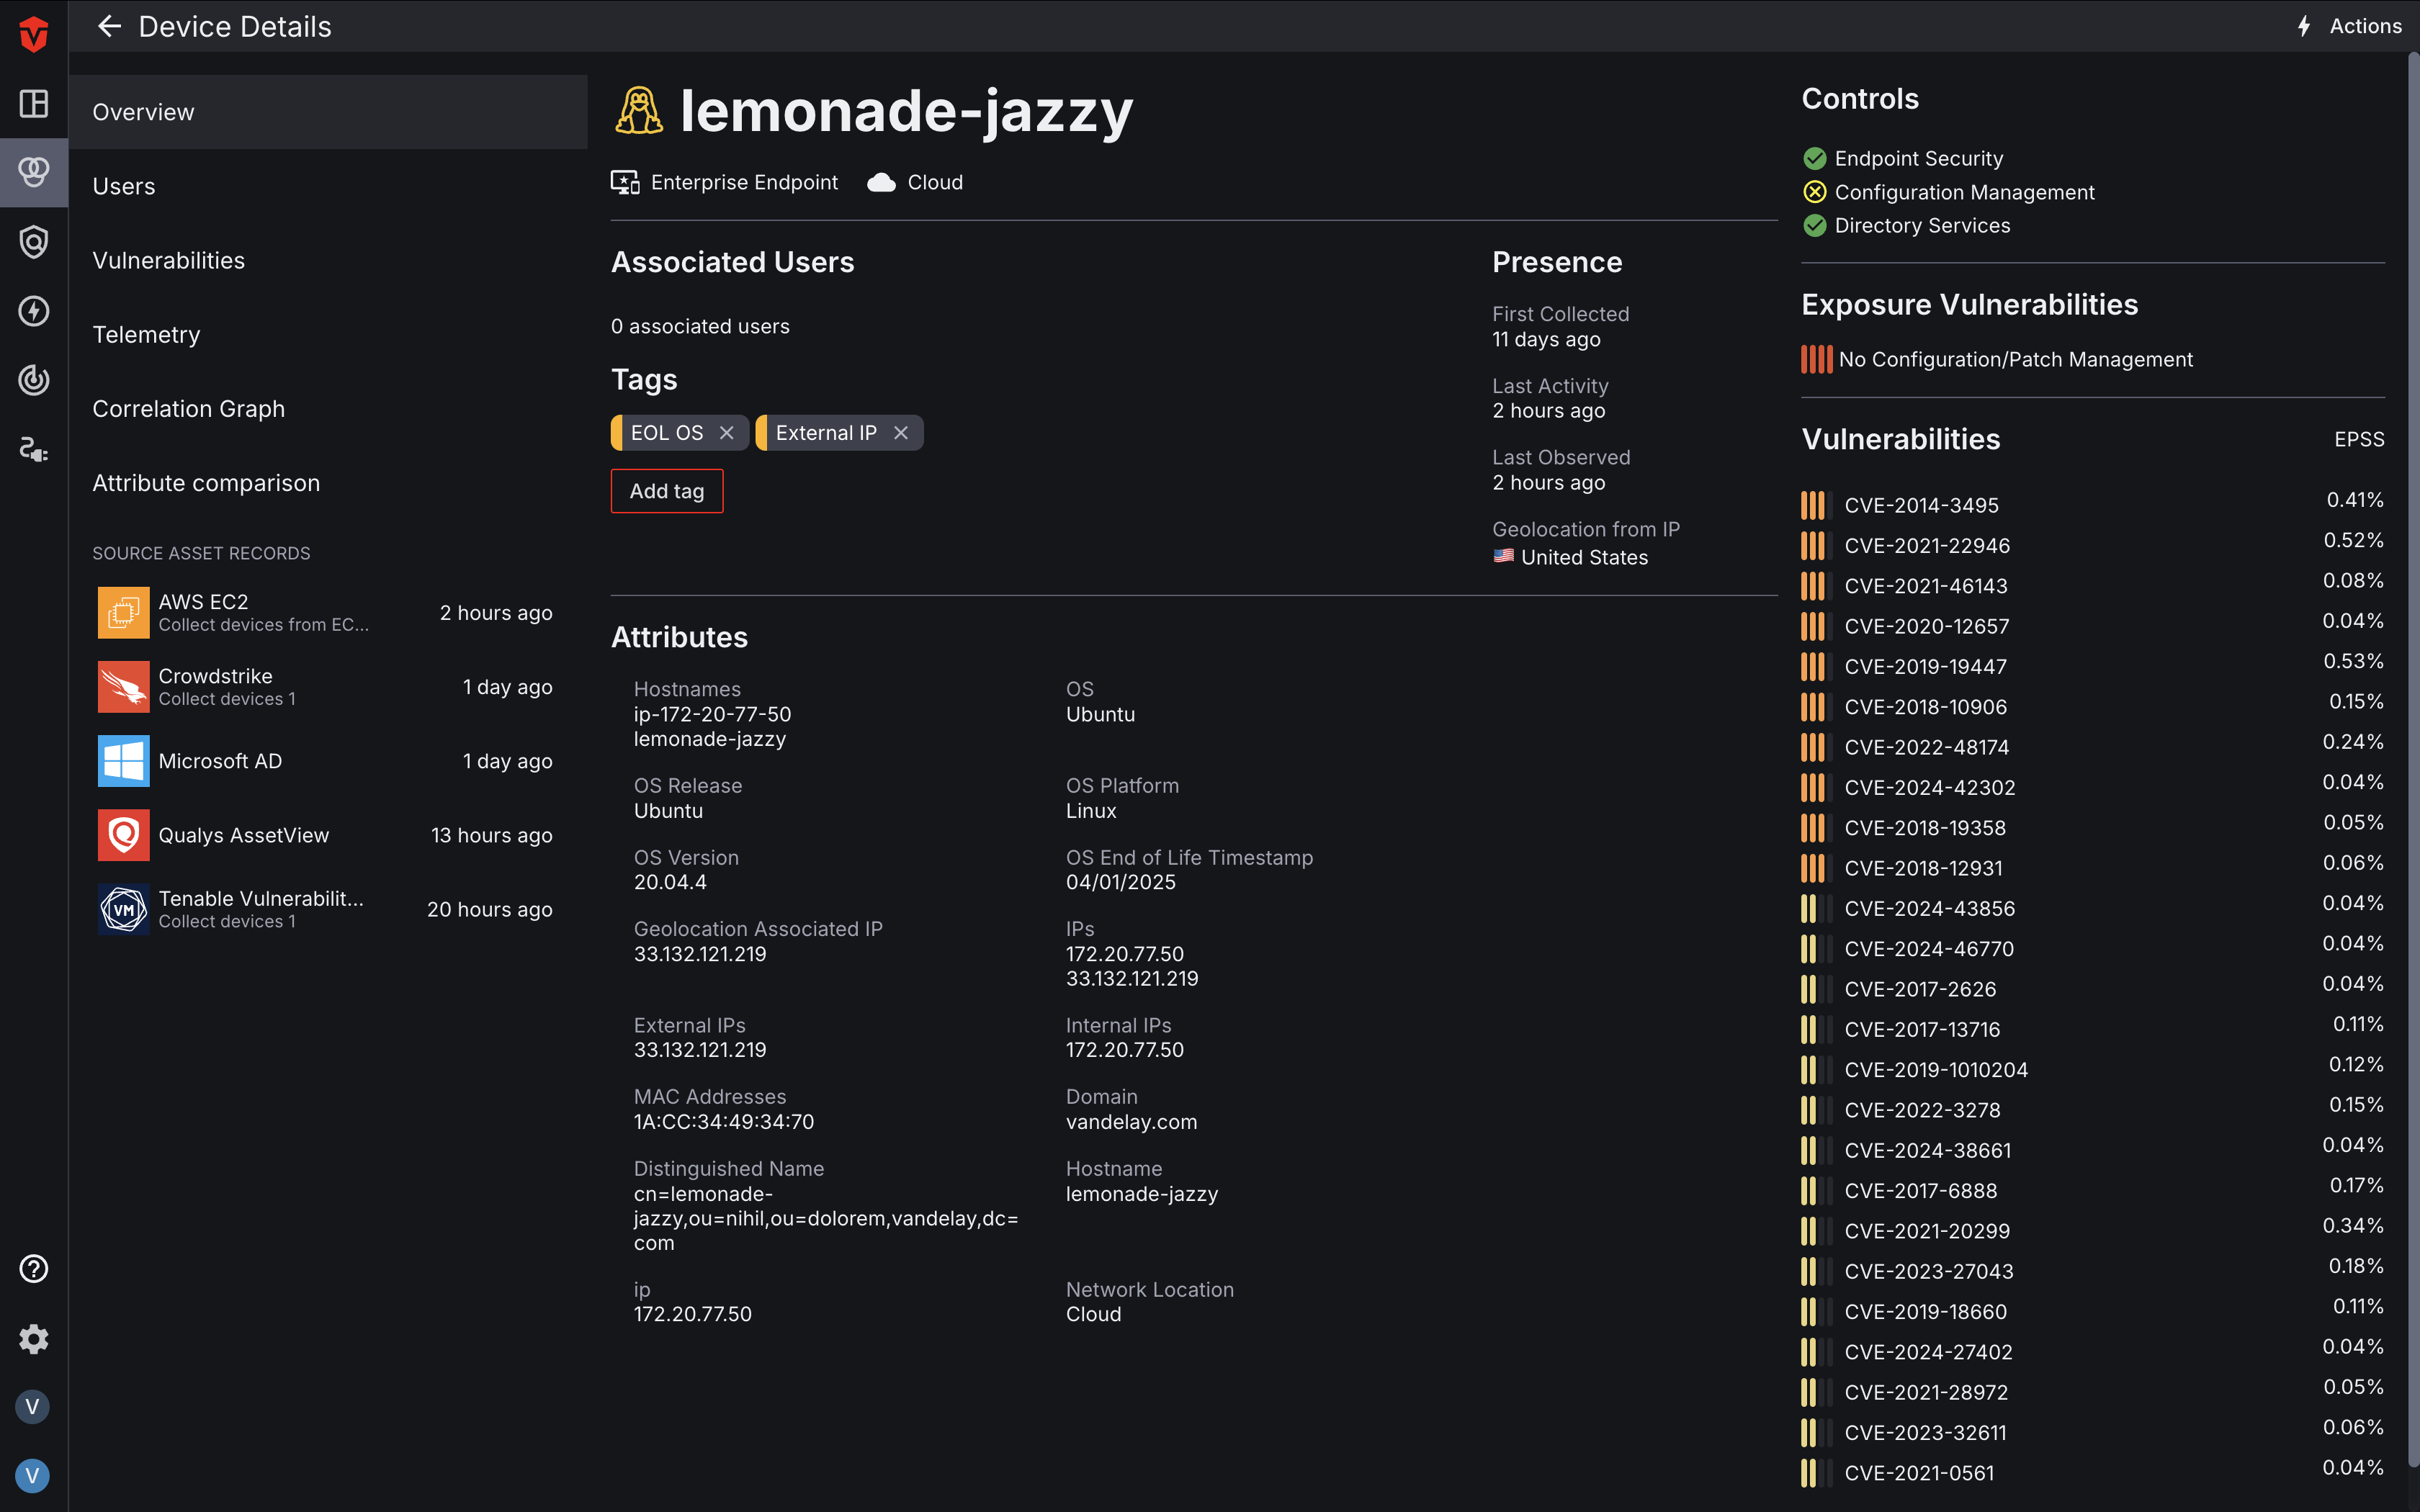
Asset Overview
The Overview tab of the Asset Details page displays information that has been aggregated from all of an asset's associated Integrations. In this tab, you can view information about Associated Assets, Tags, Presence information, Security Controls, as well as Attribute data. Some users may also see Exposure and Unified Vulnerability data as well, if they have vulnerability tracking turned on in Aurora ASM.
Related Assets
Related assets are aggregated assets that Aurora ASM has correlated with the asset you are viewing details for. For example, a device may be correlated with the user who is signed into it. You can access related assets by selecting the User or Device tab underneath the Overview tab.
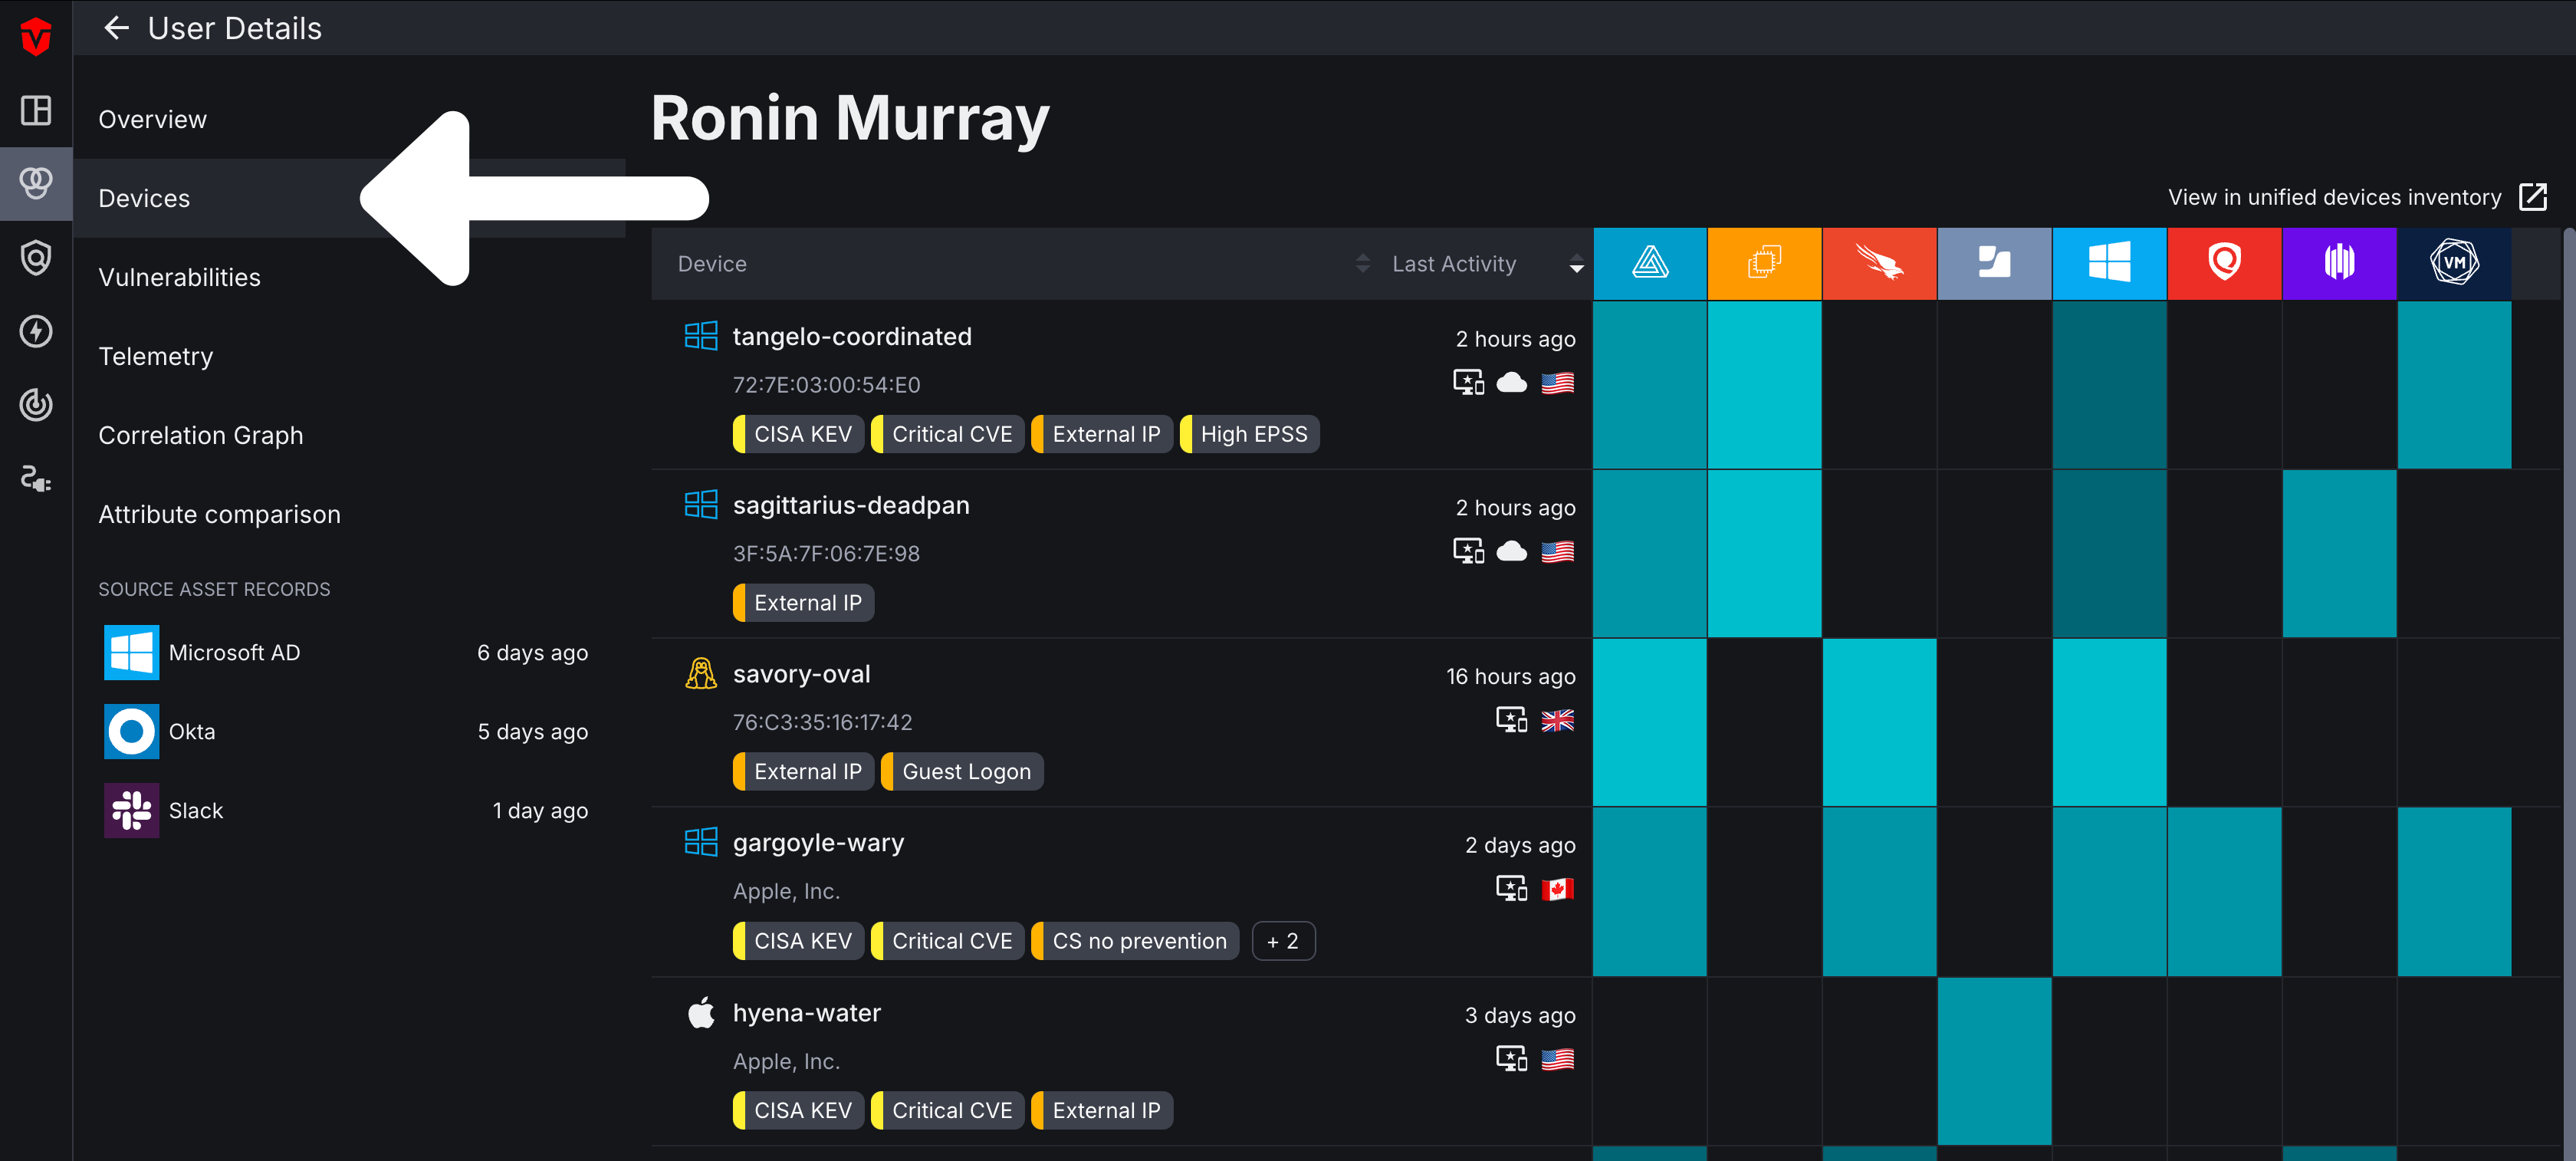
Related assets are displayed like you would view them on the Live Inventory page. This includes attribute data as well as information about when the asset last communicated with your Sources. Select an asset row to reveal additional attribute details about a particular asset.
Select an asset's name or corresponding See Details button to view its Asset Details page.
To view all of your related assets on the Live Inventory page, select the View in unified inventory link above the asset heat map at the top of the page.
Vulnerabilities
Note: This tab is only available to users who have vulnerability tracking turned on in Aurora ASM. For more information about this feature, contact your CSM.
The Vulnerabilities tab can be used to view both the Exposure and Software Vulnerabilities impacting an asset.
The Exposure Management tab allows you to view and assign asset remediation statuses to your exposure vulnerabilities.
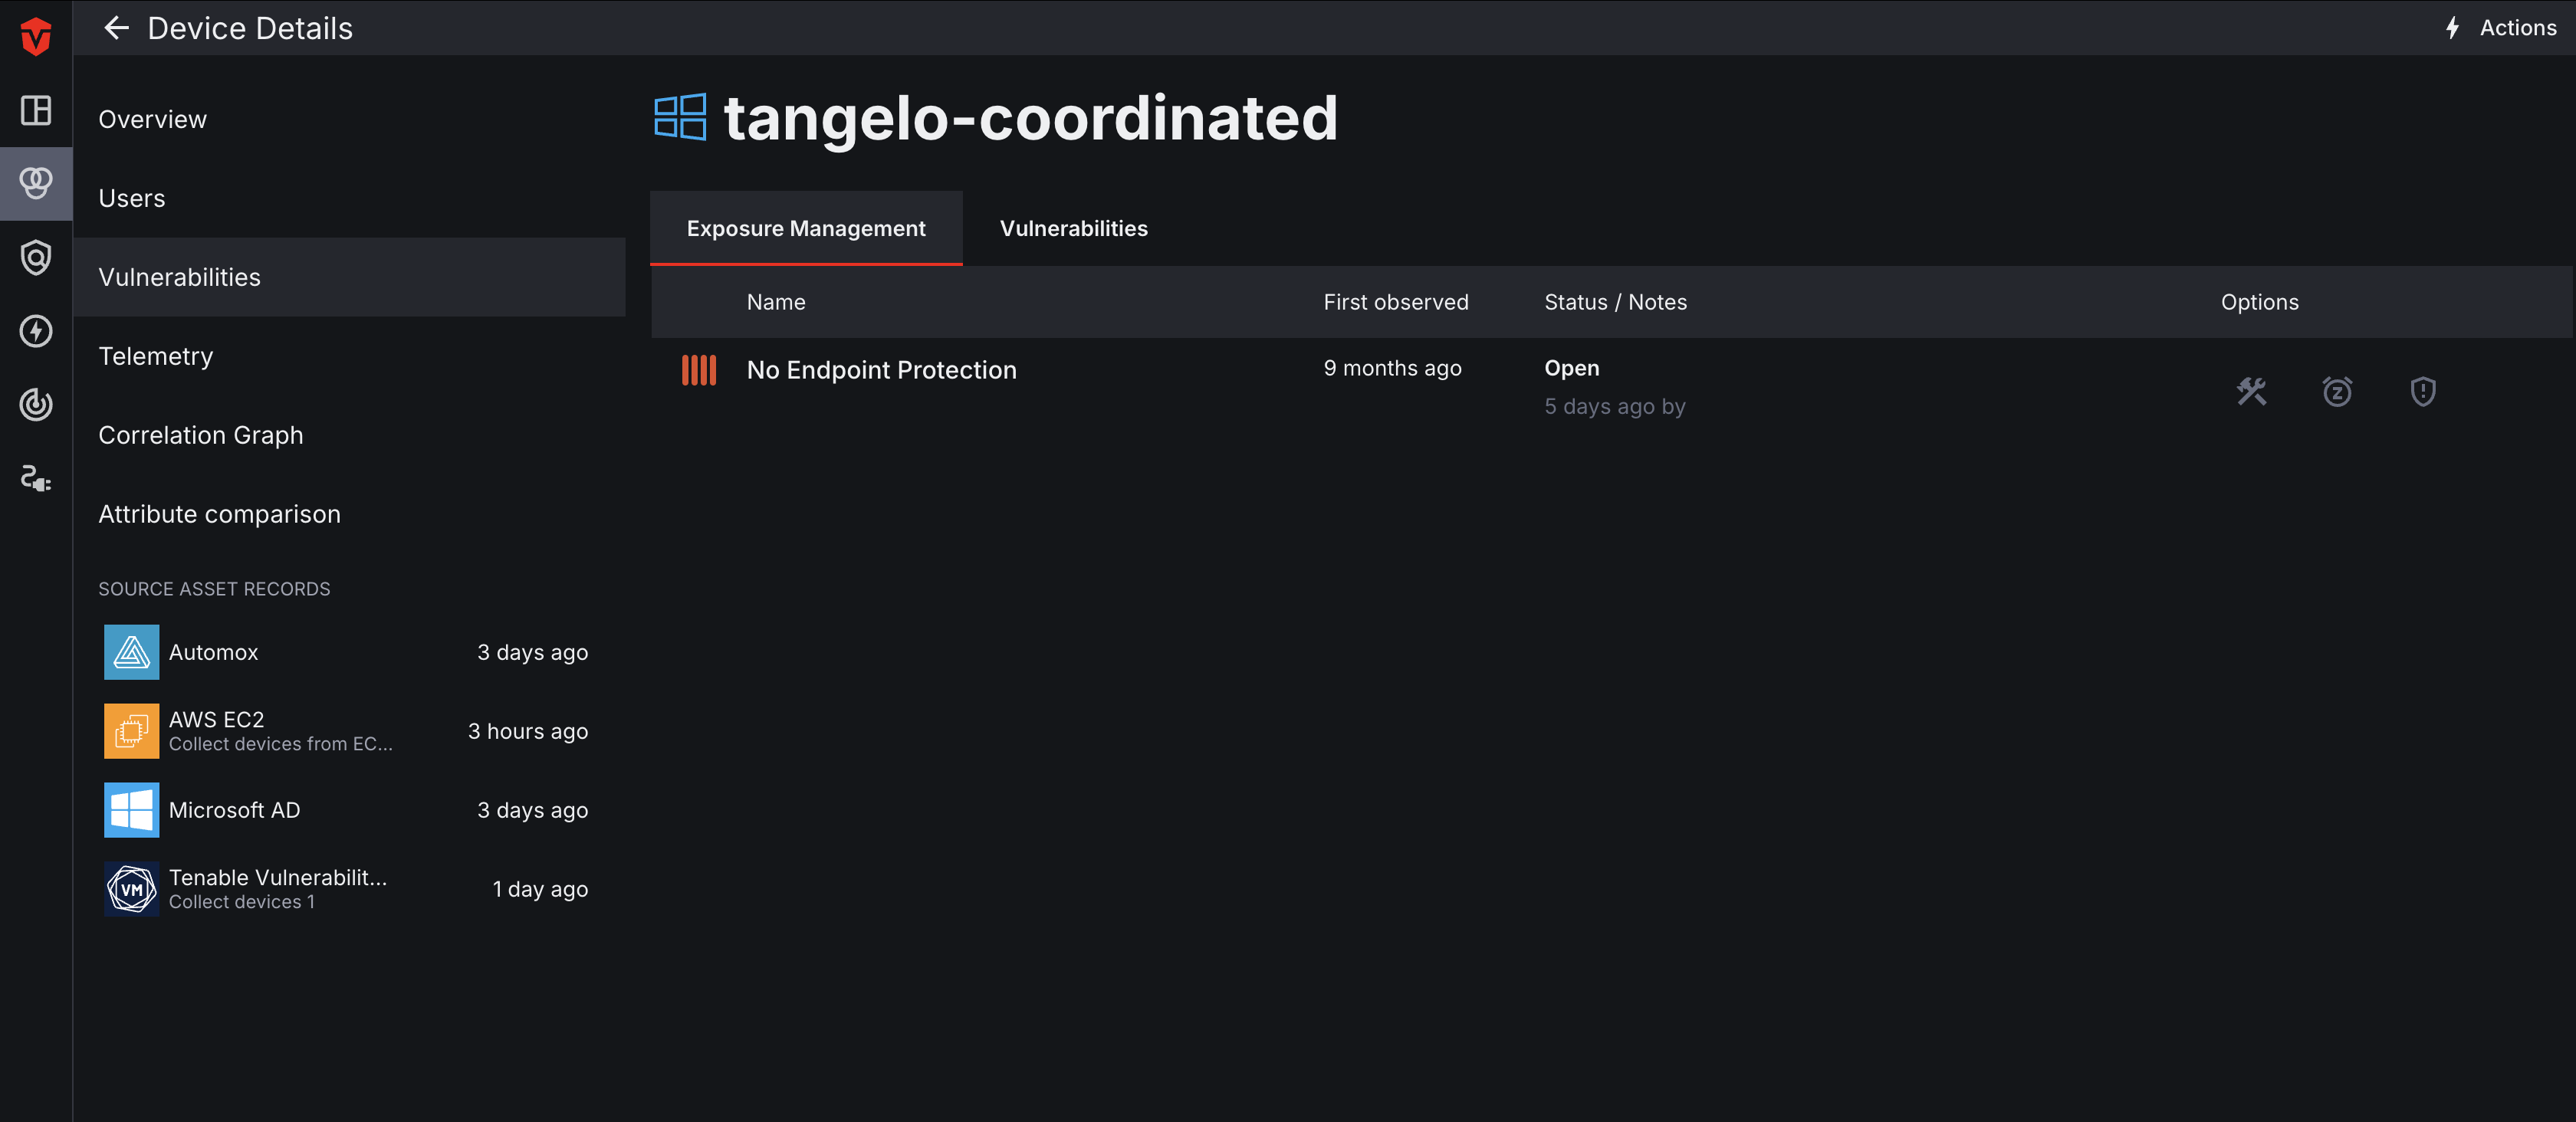
The Vulnerabilities tab provides you with a list of all software vulnerabilities. Click on a vulnerability name to learn more about it on its Asset Details page. You can also select the View in unified vulnerabilities inventory link to view all of your vulnerabilities on the Live Inventory page.
Telemetry
The Telemetry tab tracks an asset at the event level and shows how its attributes have changed over time.
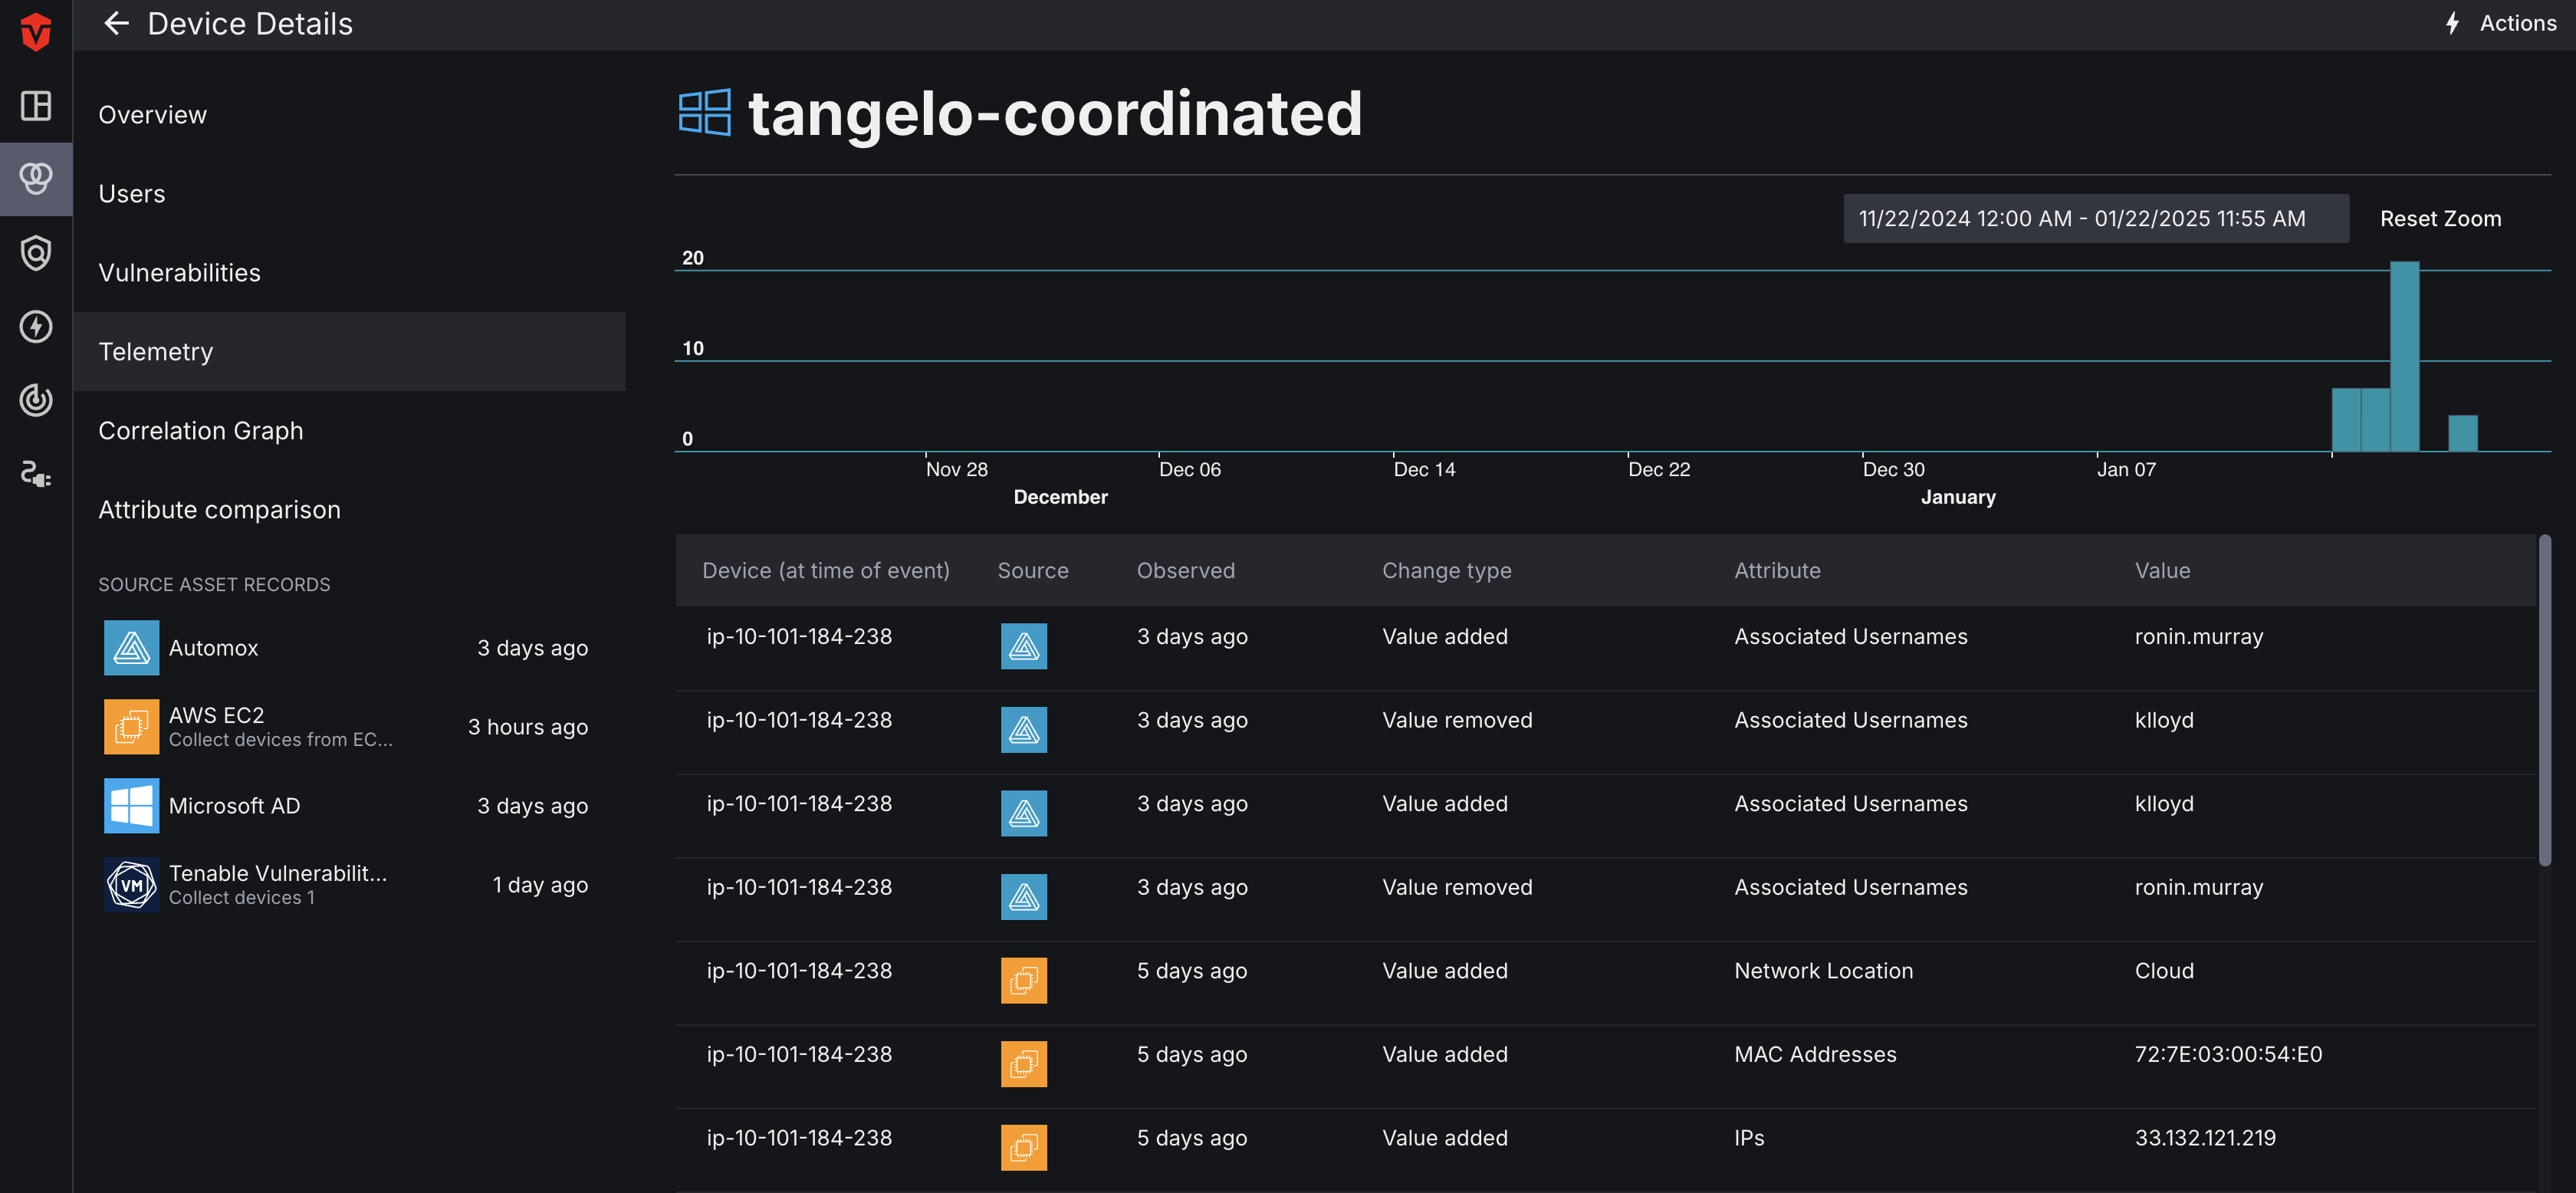
The Event History graph provides a visual representation of events that have taken place over time. Use the date picker or click and drag over a specific section of the graph to view events within a specific time frame. All events meeting the conditions you've established will be listed in the Event List below the graph.
Correlation Graph
The Correlation Graph is a graphical representation of how the Asset Correlation Engine (ACE) built the relationships between source records to identify the unified asset. Users can use this tool to better understand why Device assets are correlated. It may also be used to identify potential correlation issues for Aurora ASM to resolve. Select the Correlation Graph tab to access this feature.
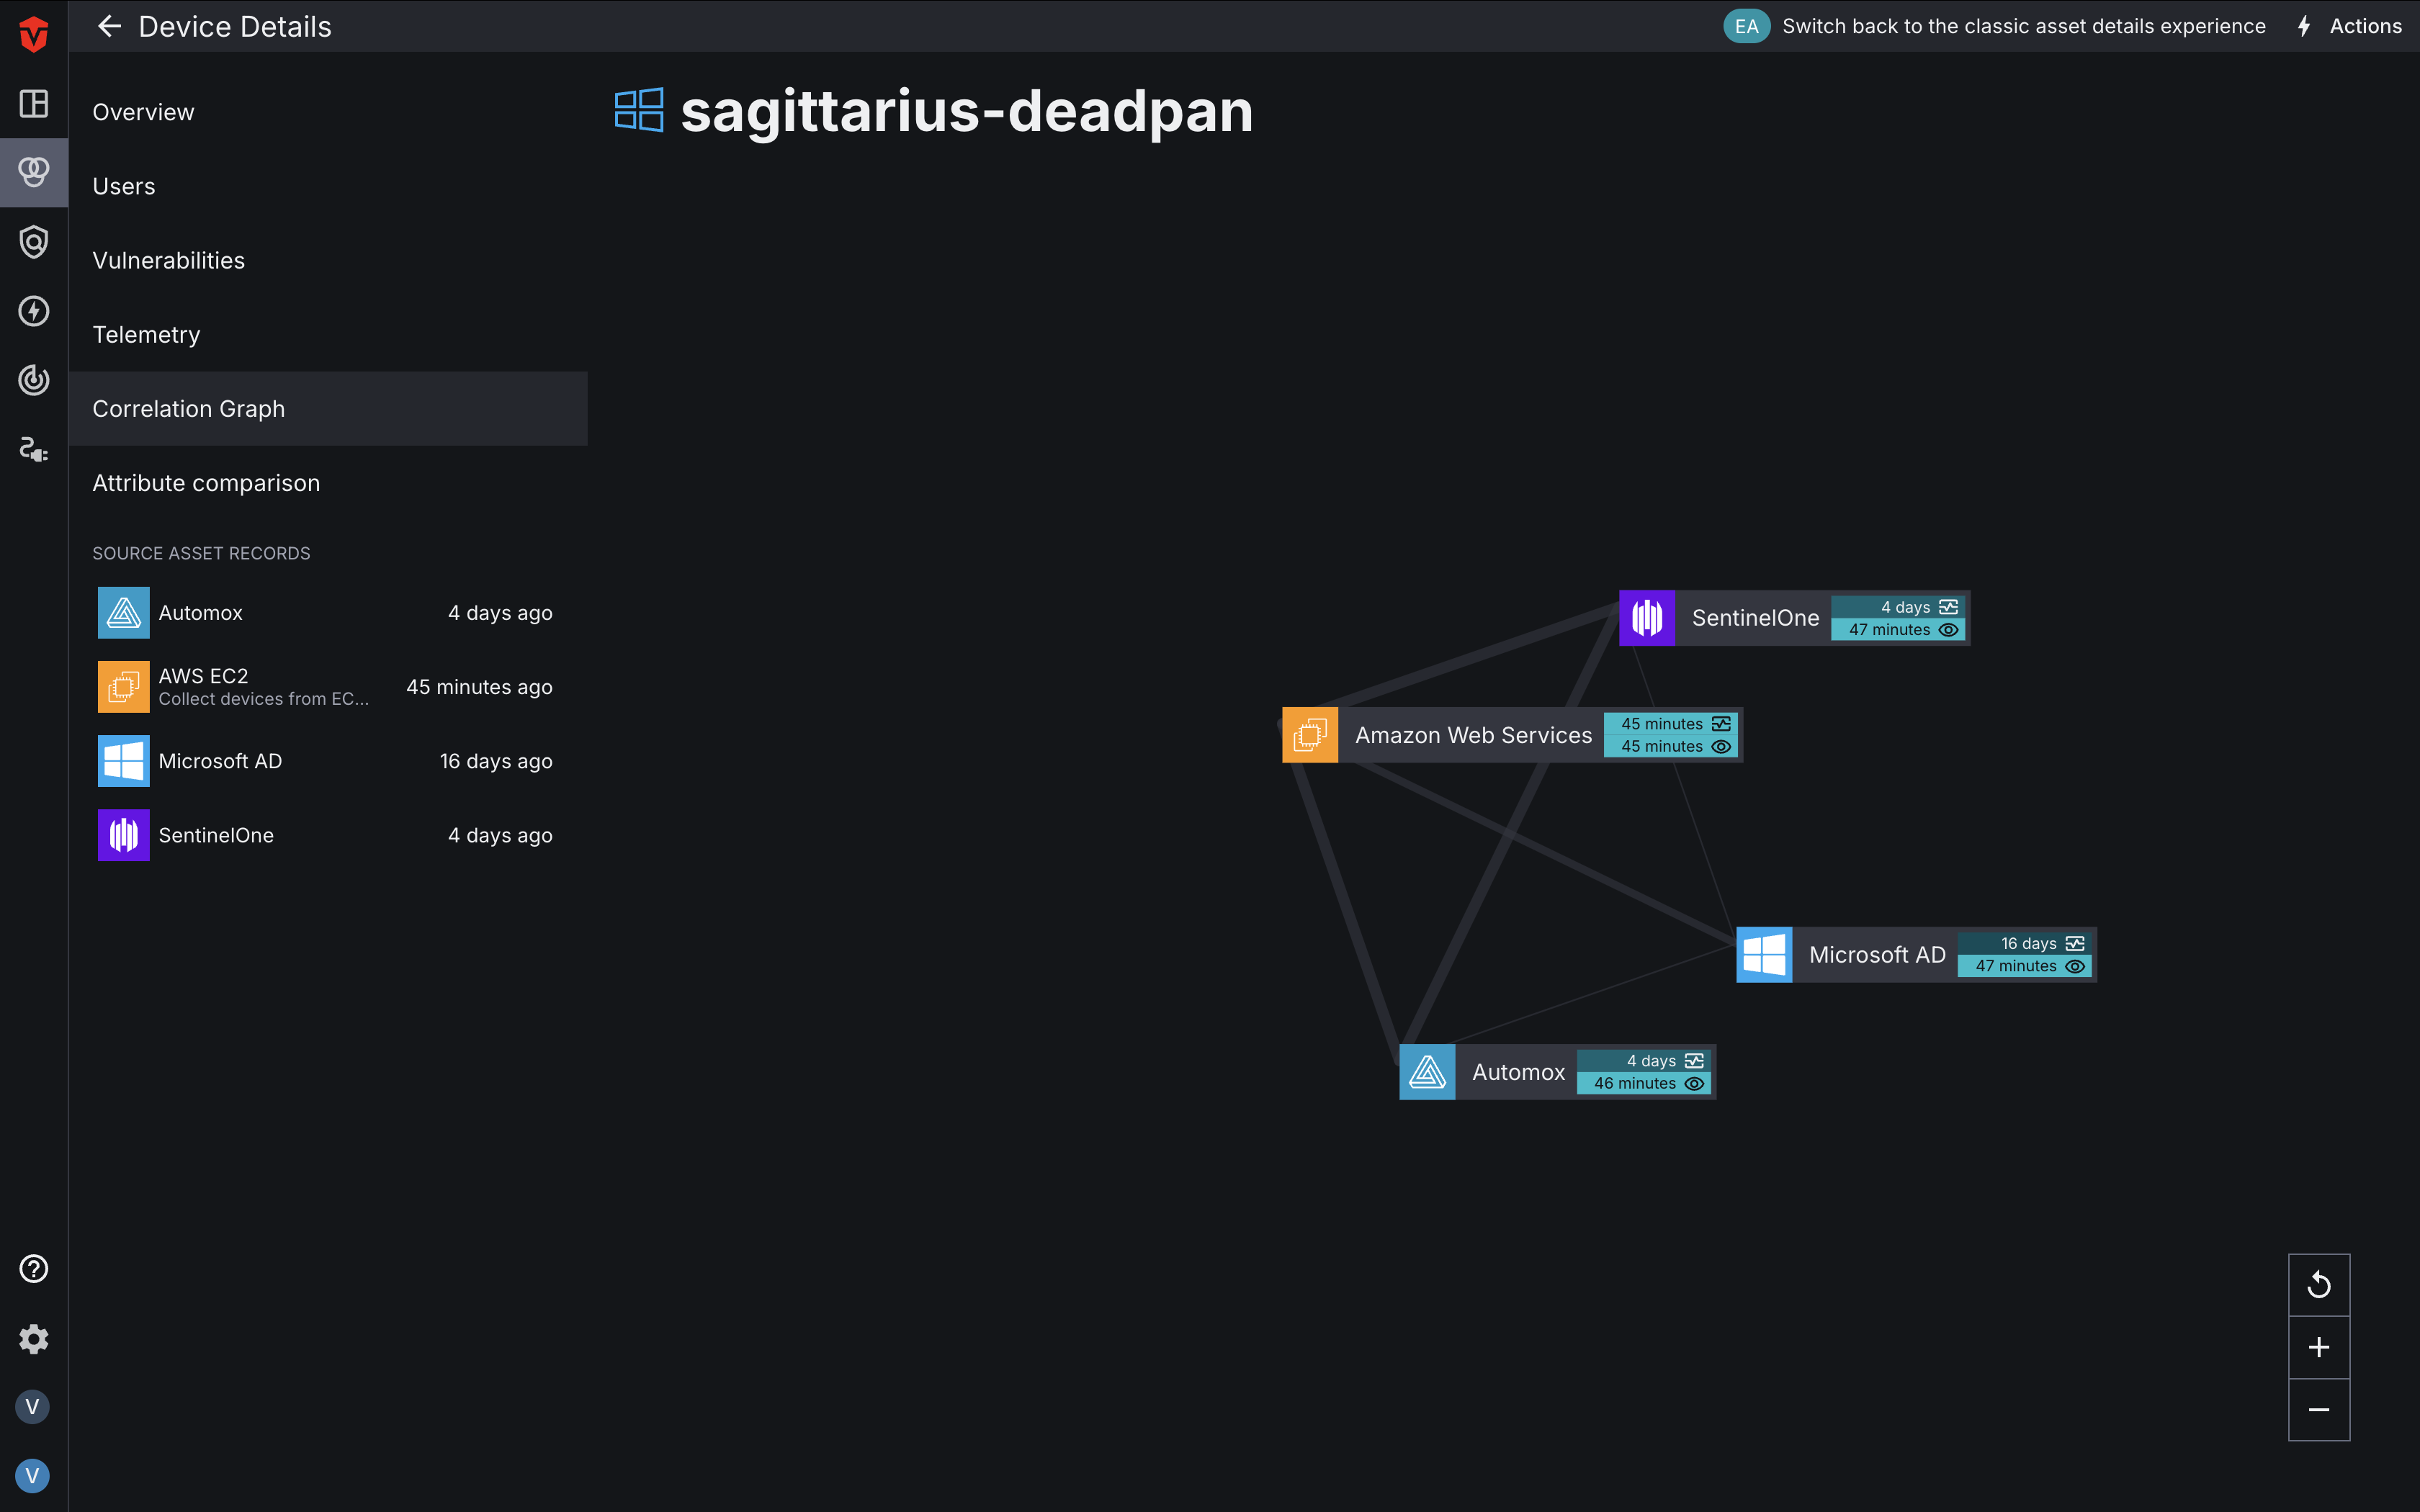
Each node corresponds with one of your Source asset records along with when it was Last Observed ( ) by Aurora ASM, as well as its Last Activity (
 ) timestamp according to the Source.

Select a node to view what other Source asset records it correlates to. Each line represents a correlation (relationship) between two Source asset records.
Hover over a line to view the correlating attributes between asset records that identified them as being the same asset.
Line thickness represents the level of confidence in a correlation. Thicker lines indicate a higher confidence level while thinner lines indicate a lower confidence level.
- A higher number of attribute correlations increases confidence.
- Attribute type also impacts confidence levels. For example, a MAC Address correlation generally increases confidence more than a Hostname.

Click and drag a node to change its position. The Correlation Graph is responsive and will adjust other nodes accordingly.
Attribute Comparison
The Attribute Comparison tab allows you to compare attribute values reported by each of your Sources. Attribute names are listed in the far-left column of the attribute chart with each attribute value reported by one of your Sources being listed in its respective column. The Consensus Value column lists the unified attribute value that Aurora ASM has determined using data from your Sources.
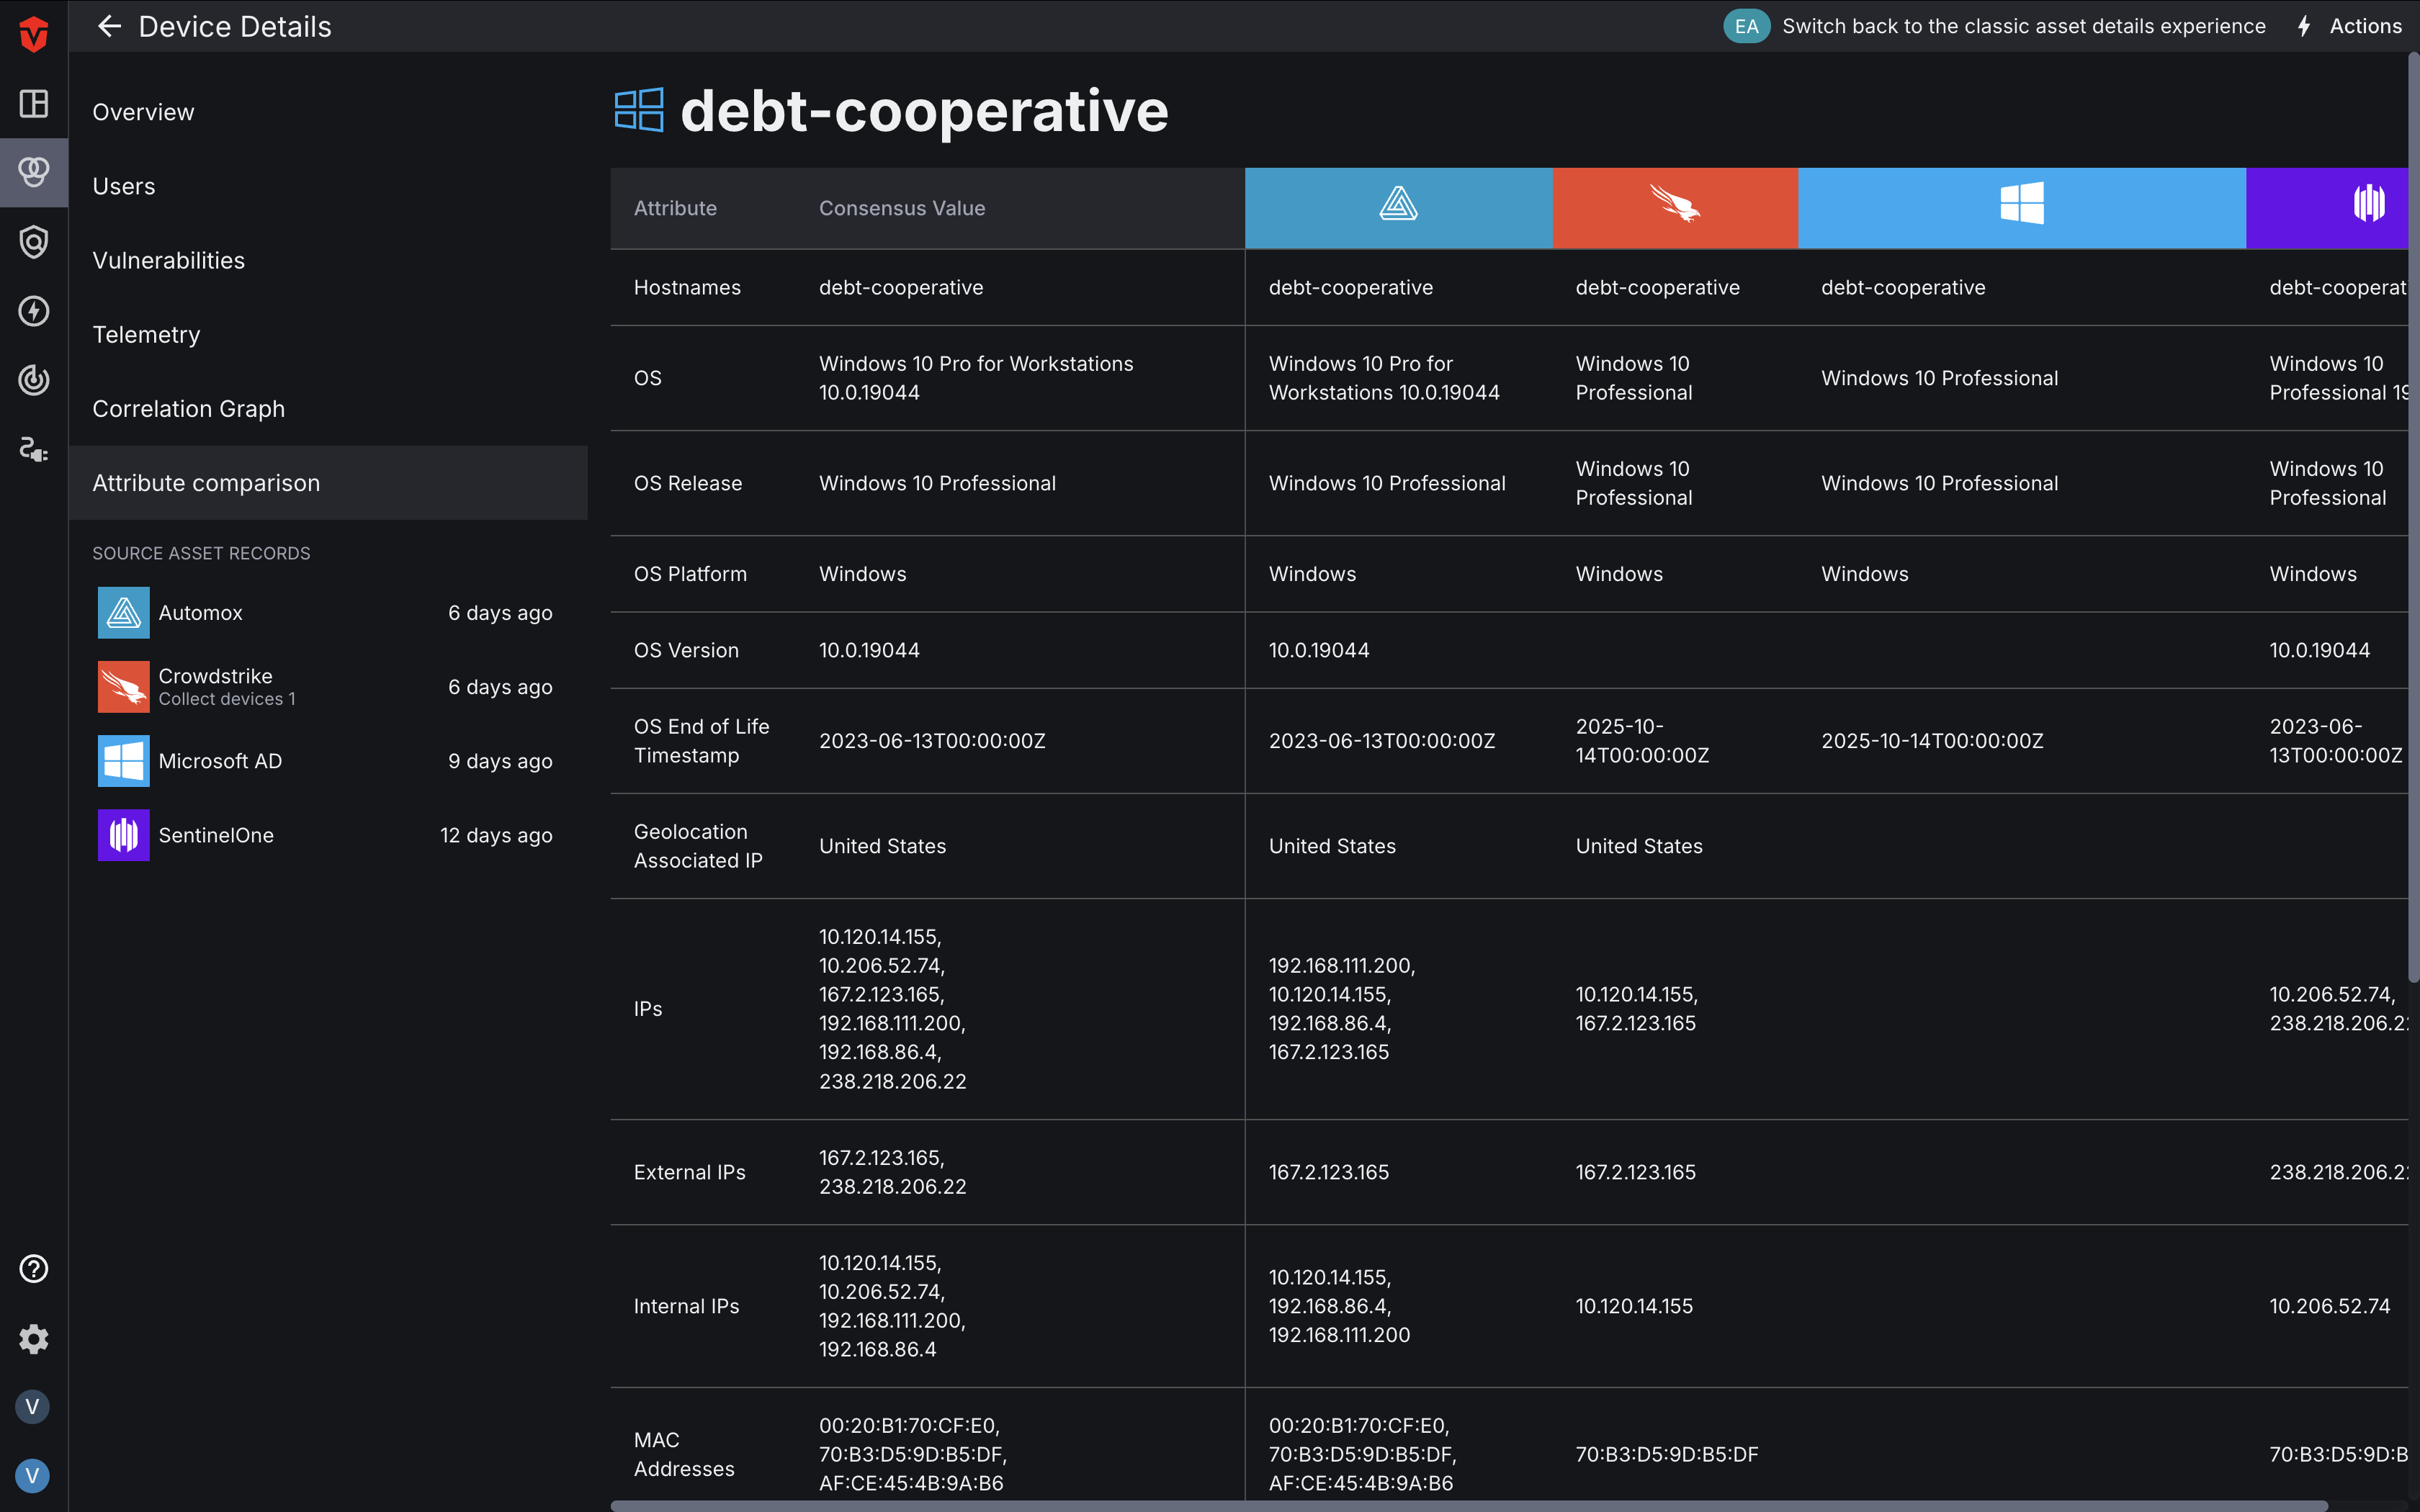
Source Asset Records
Note: This section only covers Source Asset Records for User and Device assets. Information in this section will differ for vulnerabilities.
Source Asset Records provide you with information about your asset as it is being reported by a particular Integration. Select an Integration to learn more about the data it has collected.
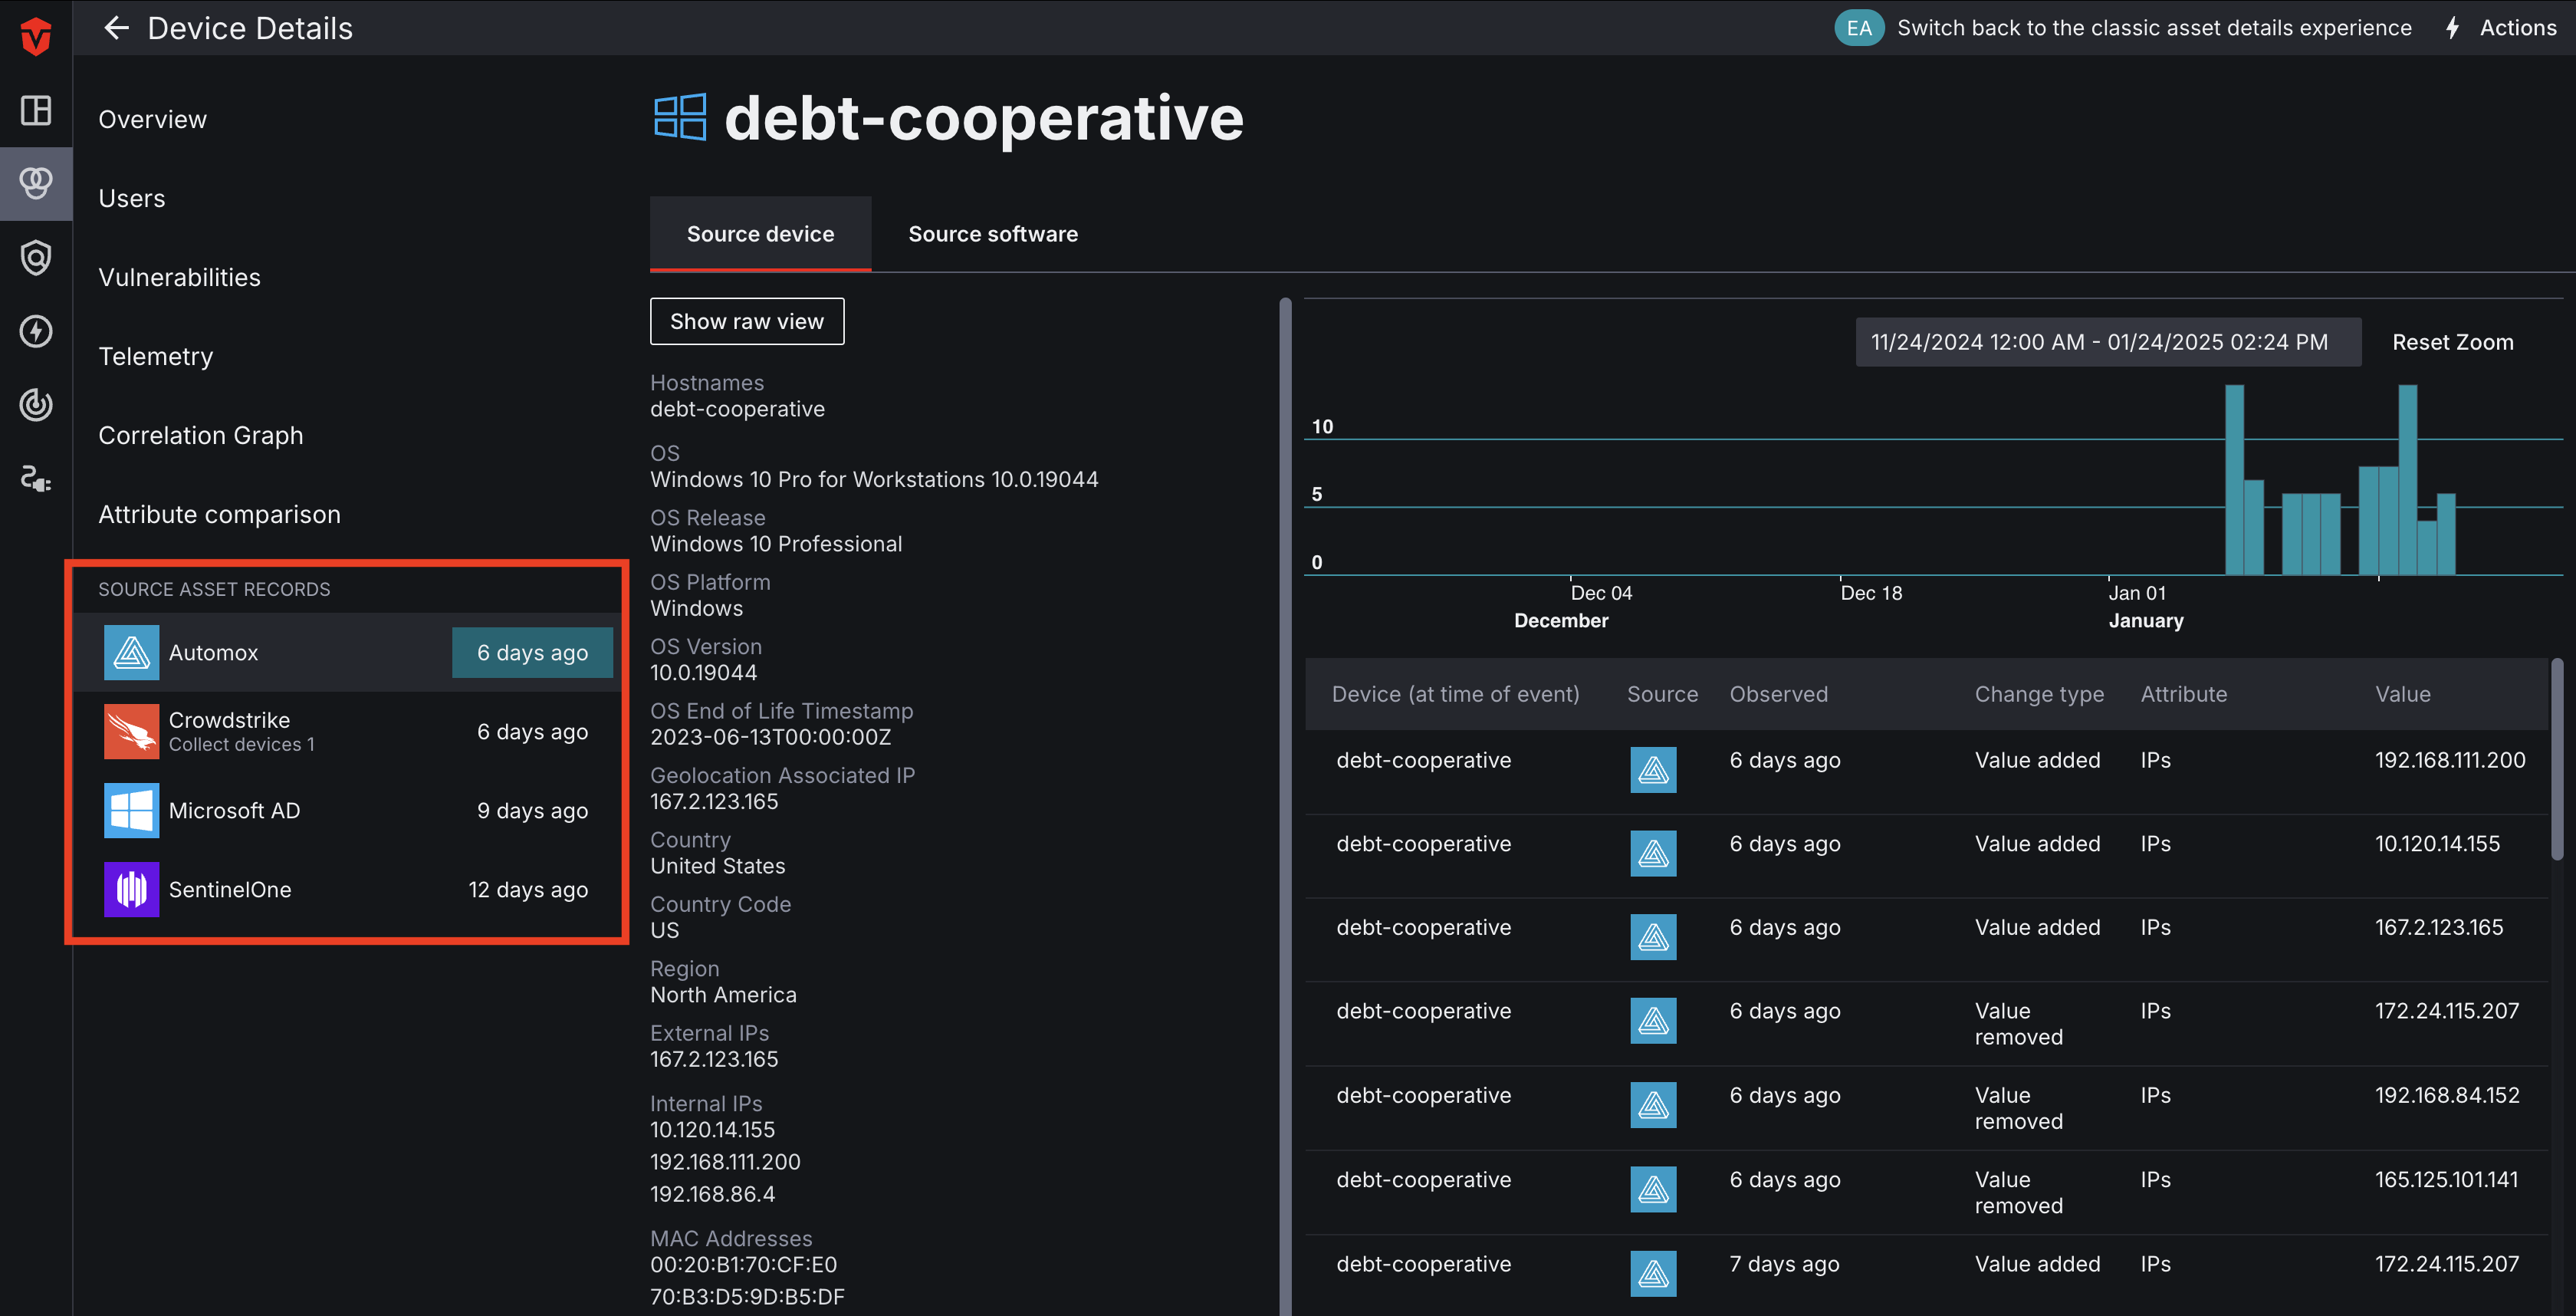
Source Telemetry
The Event History graph and table to the right of your Source attributes list allow you to view any telemetry events associated with that asset by Integration. This feature functions very similarly to the Event History section of the Telemetry page as well as the Telemetry tab on the Asset Details page.
Asset History
Asset History functionality is only available for Devices at this point in time.
The Source Telemetry Event History graph has an additional Asset History feature for Devices. This feature allows users to compare the current attribute values of a device against values captured in past telemetry events.
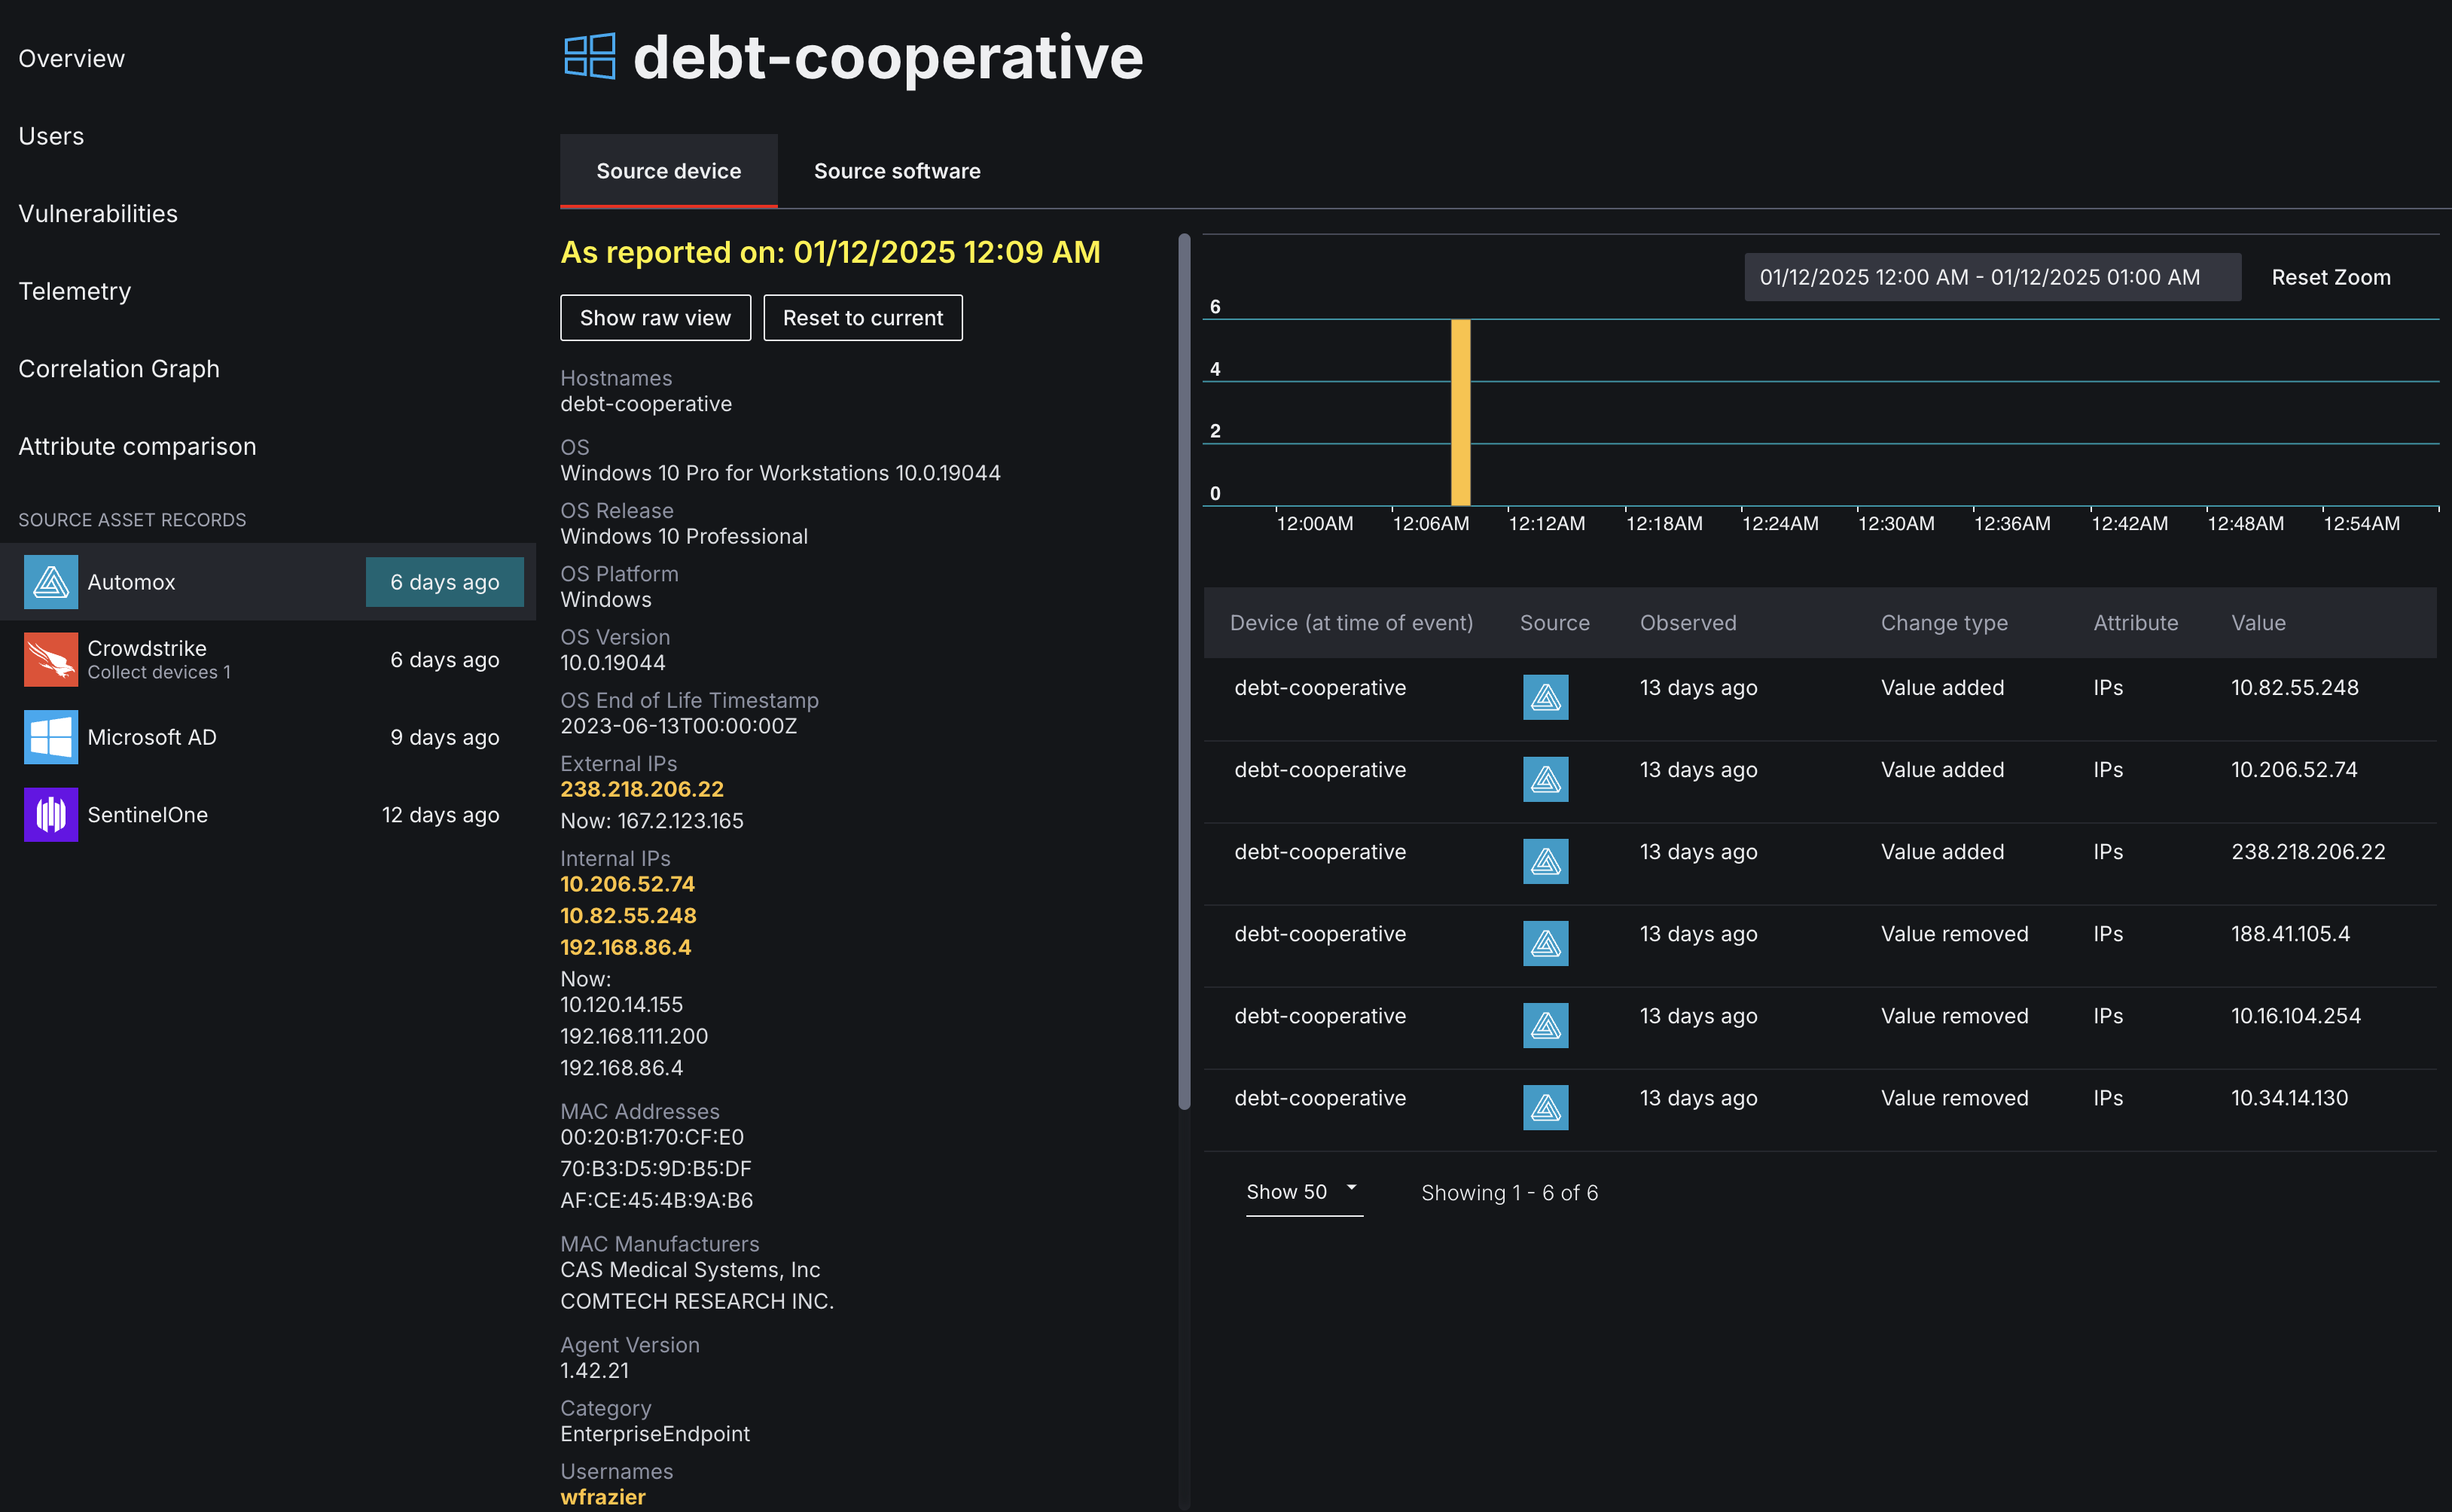
Telemetry events can be captured as frequently as every minute. As such, it may take several clicks to get to the event you are interested in viewing.
Select the bar on the timeline that corresponds with the day of the event you would like to review. Next, the hour followed by the exact minute it took place.

Once the event has been selected, its timeline bar will turn yellow and a timestamp will appear in the header. Past data that differs from current data will also be displayed in yellow.
Take the image below, for example, where we can see that the Internal IP reported on 01/07/2025 09:57 AM differs from the Internal IP currently associated with the device.
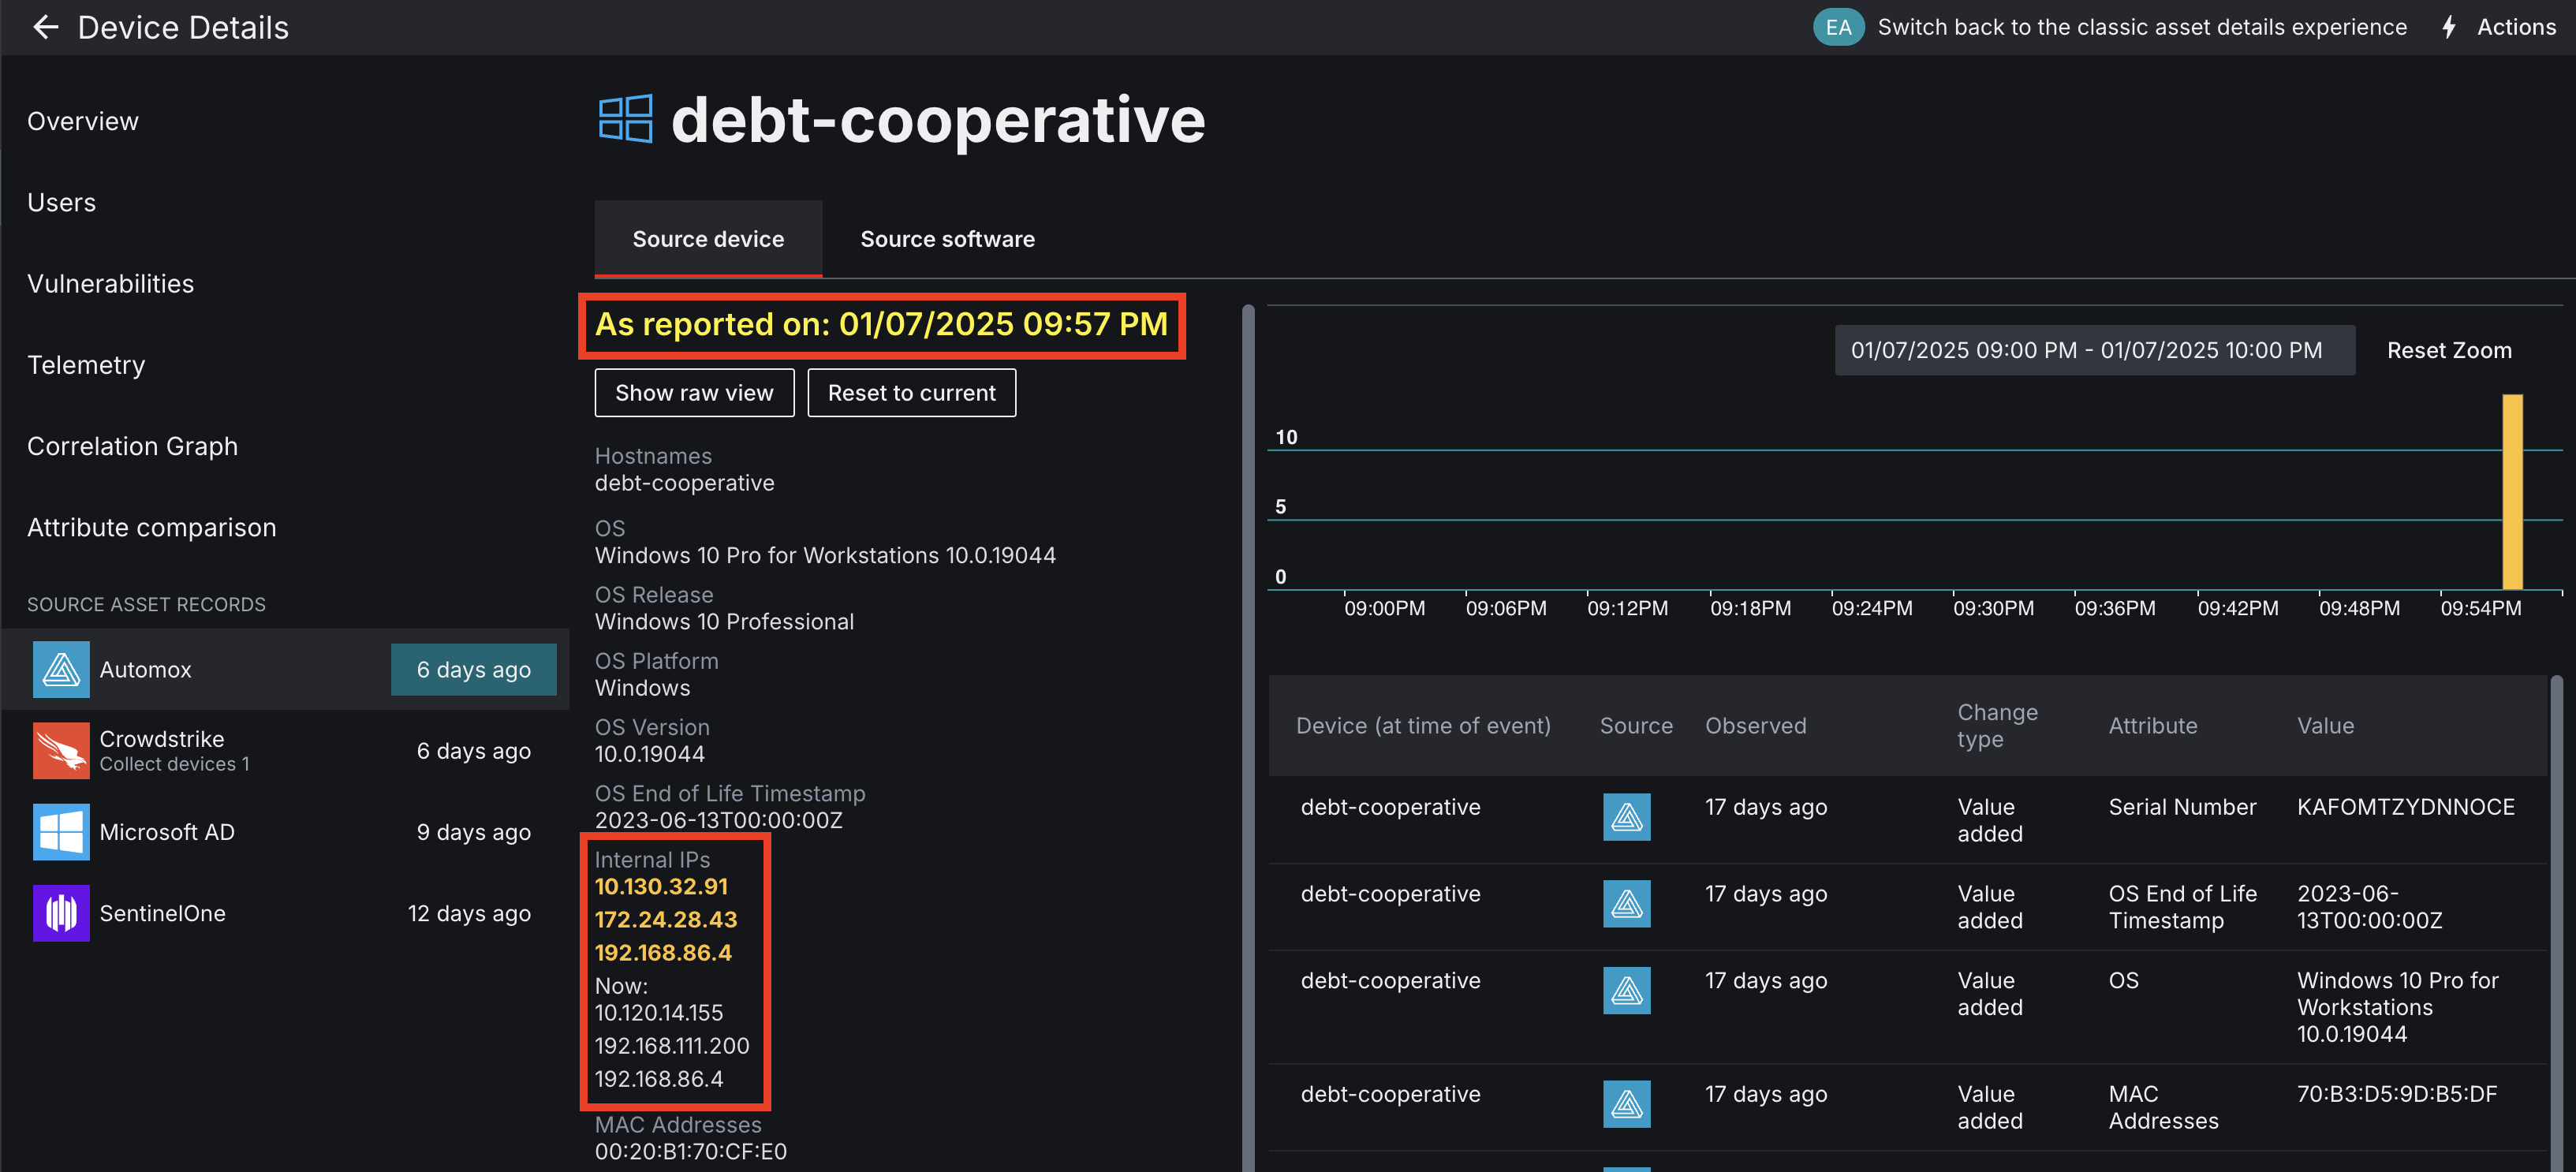
Once you have finished viewing a snapshot, you can reset the timeline by selecting the Reset to current device button.
Source Software
Note: Software integrations must be configured in the same Source Configuration as your Device integrations for software data to appear in this tab.
Integrations that have been configured to collect Software assets will have an additional Software tab. Select this tab to view a complete list of software associated with a Device.
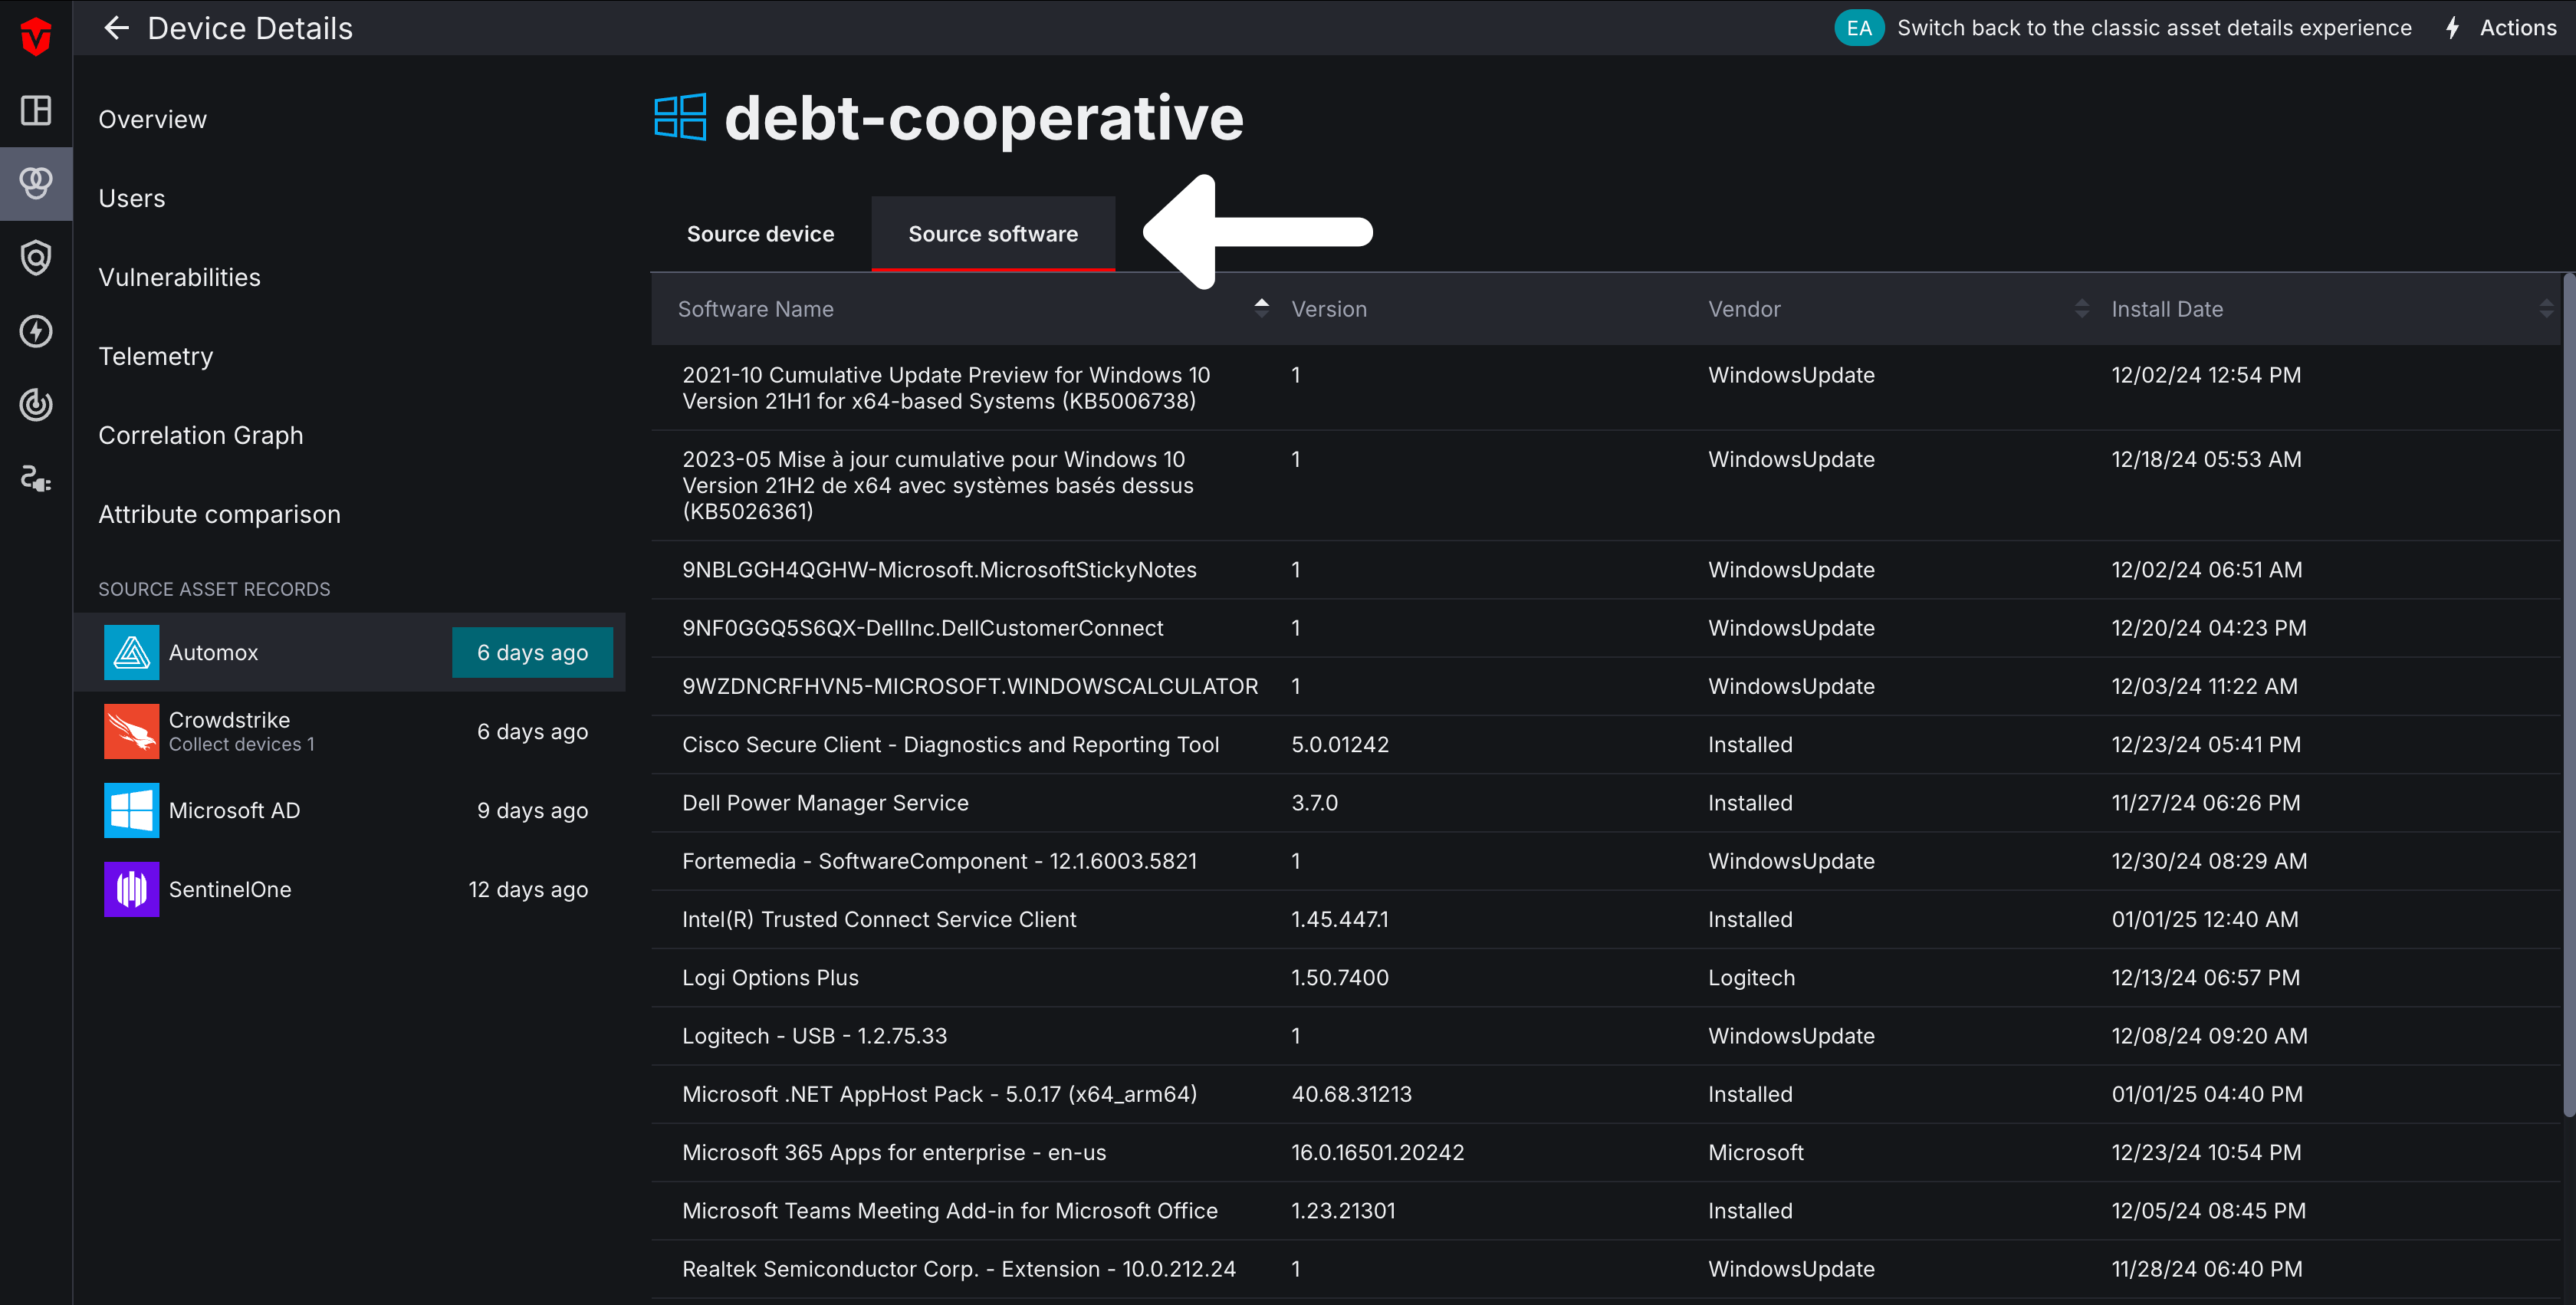
Click here to learn more about Software assets.
Source Vulnerabilities
Note: Vulnerability integrations must be configured in the same Source Configuration as your Device integrations for vulnerability data to appear in this tab.
Source Integrations that track vulnerabilities will have an additional Source Vulnerabilities tab. Select this tab to view a complete list of vulnerabilities for a Device.
Click here to learn more about Vulnerability assets.
Raw Data View
Some Integrations allow you to view and search through raw data in addition to the Source attribute data that they provide. Select the Show raw view button to view raw data pulled from an Integration. From there, you can use the Filter field to search for specific information.
Updated 2 months ago